
Aggregated Reports: Stop studying one flop at a time
 Jan Przysucha
Founder of Poker Academy. Writes the product guides and updates on this blog.
~4 min read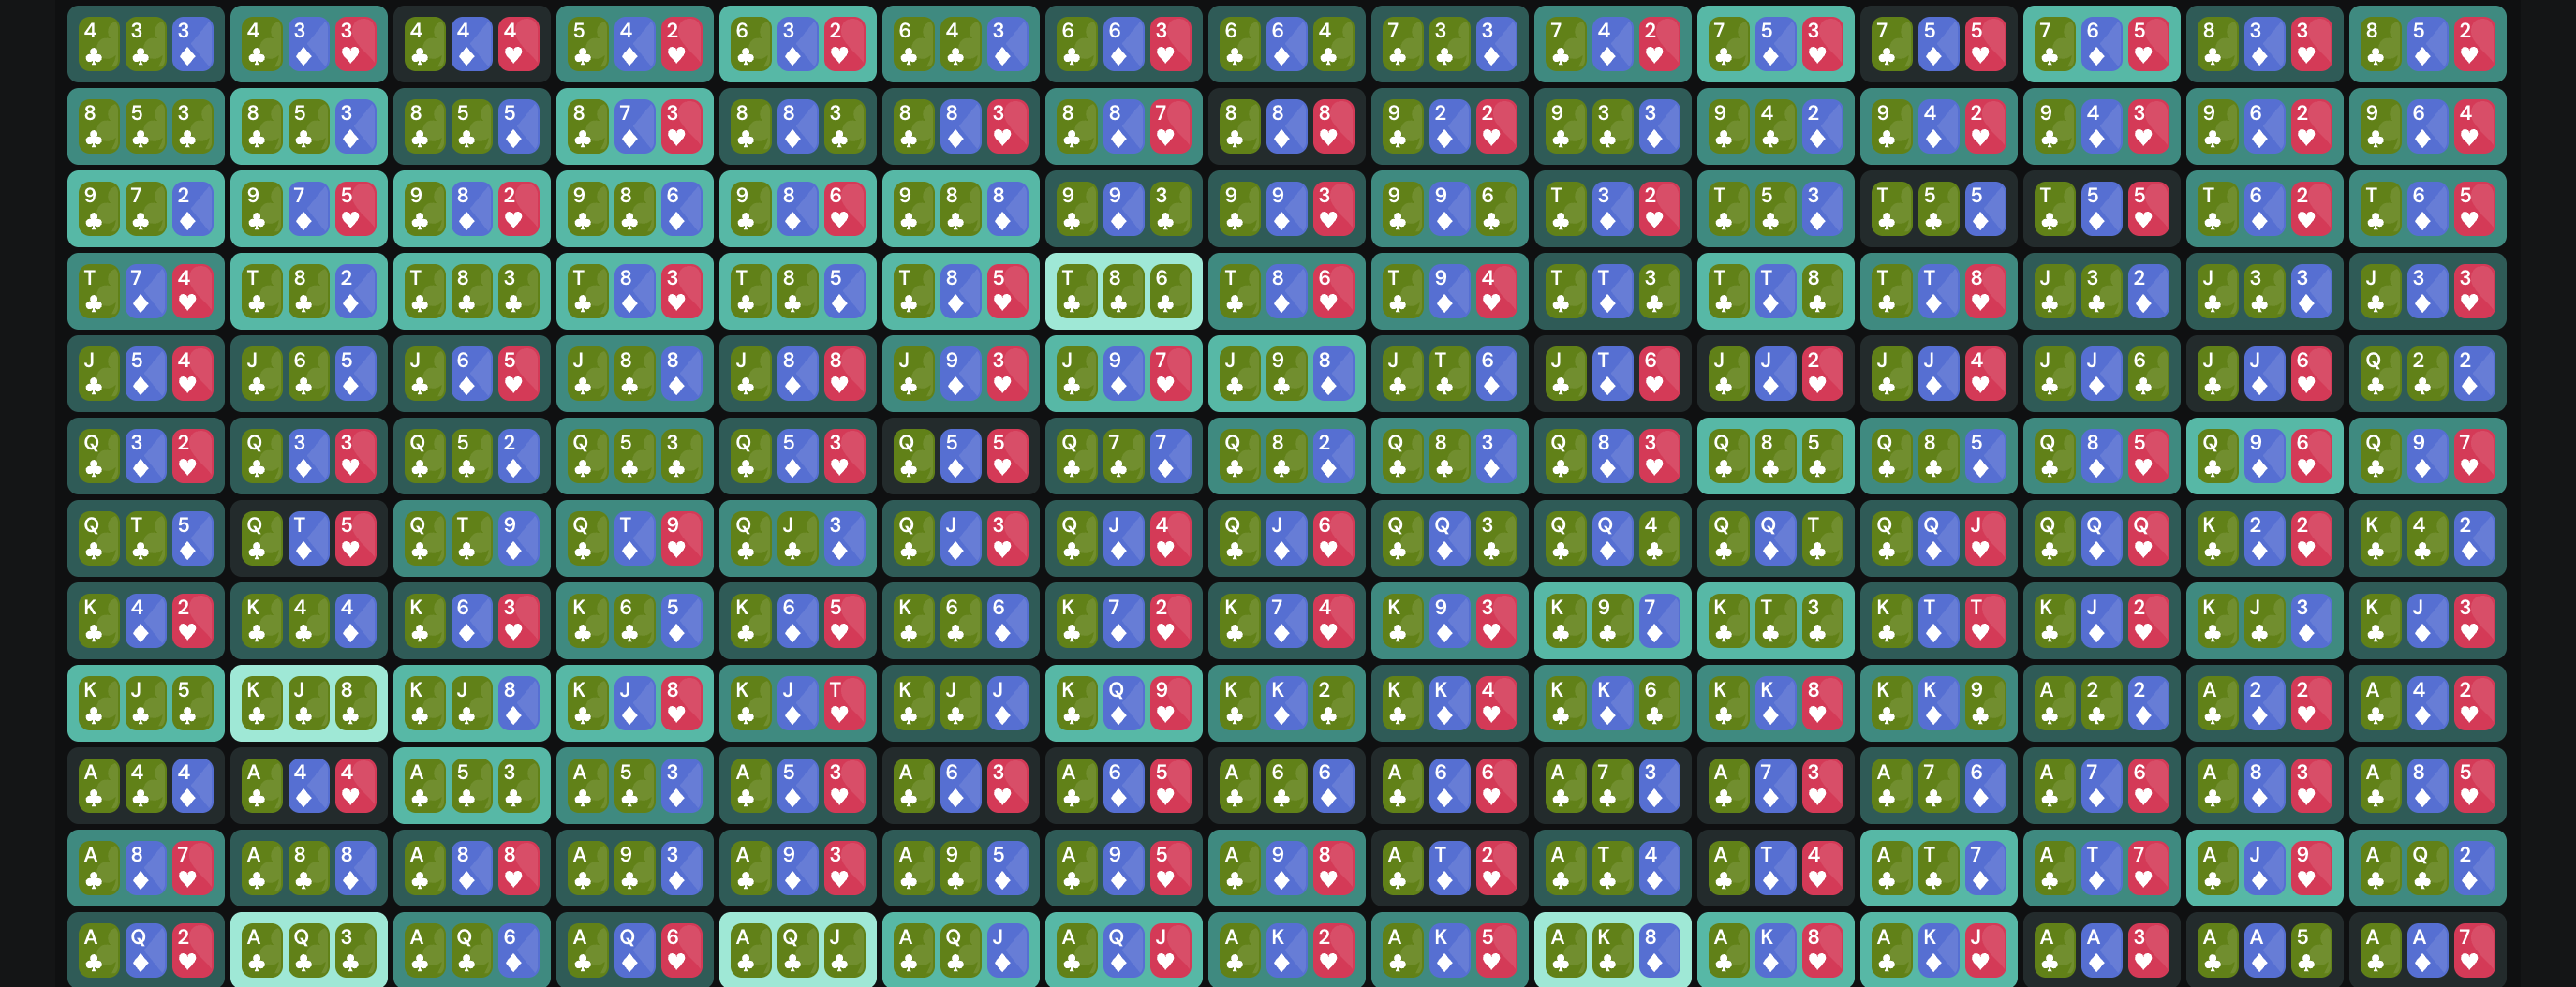
For years I studied postflop one flop at a time. Solve, stare, write something down, next flop. Ten flops later: a page of numbers and no rule.
An aggregated report solves one preflop spot across a whole set of flops and averages the solver’s strategy, weighted by how many real deals each flop stands for. This post is a tour of what you can do with one.
The rule does not live on one flop. It lives across all of them.
One spot, every flop
A report takes one preflop spot – positions, pot, stacks, ranges, sizes – and solves it on a whole set of flops. A subset of 25, 49, 95 or 184. All 1,755 distinct flops. Your own list. Or all 49 turn cards over a solved flop.
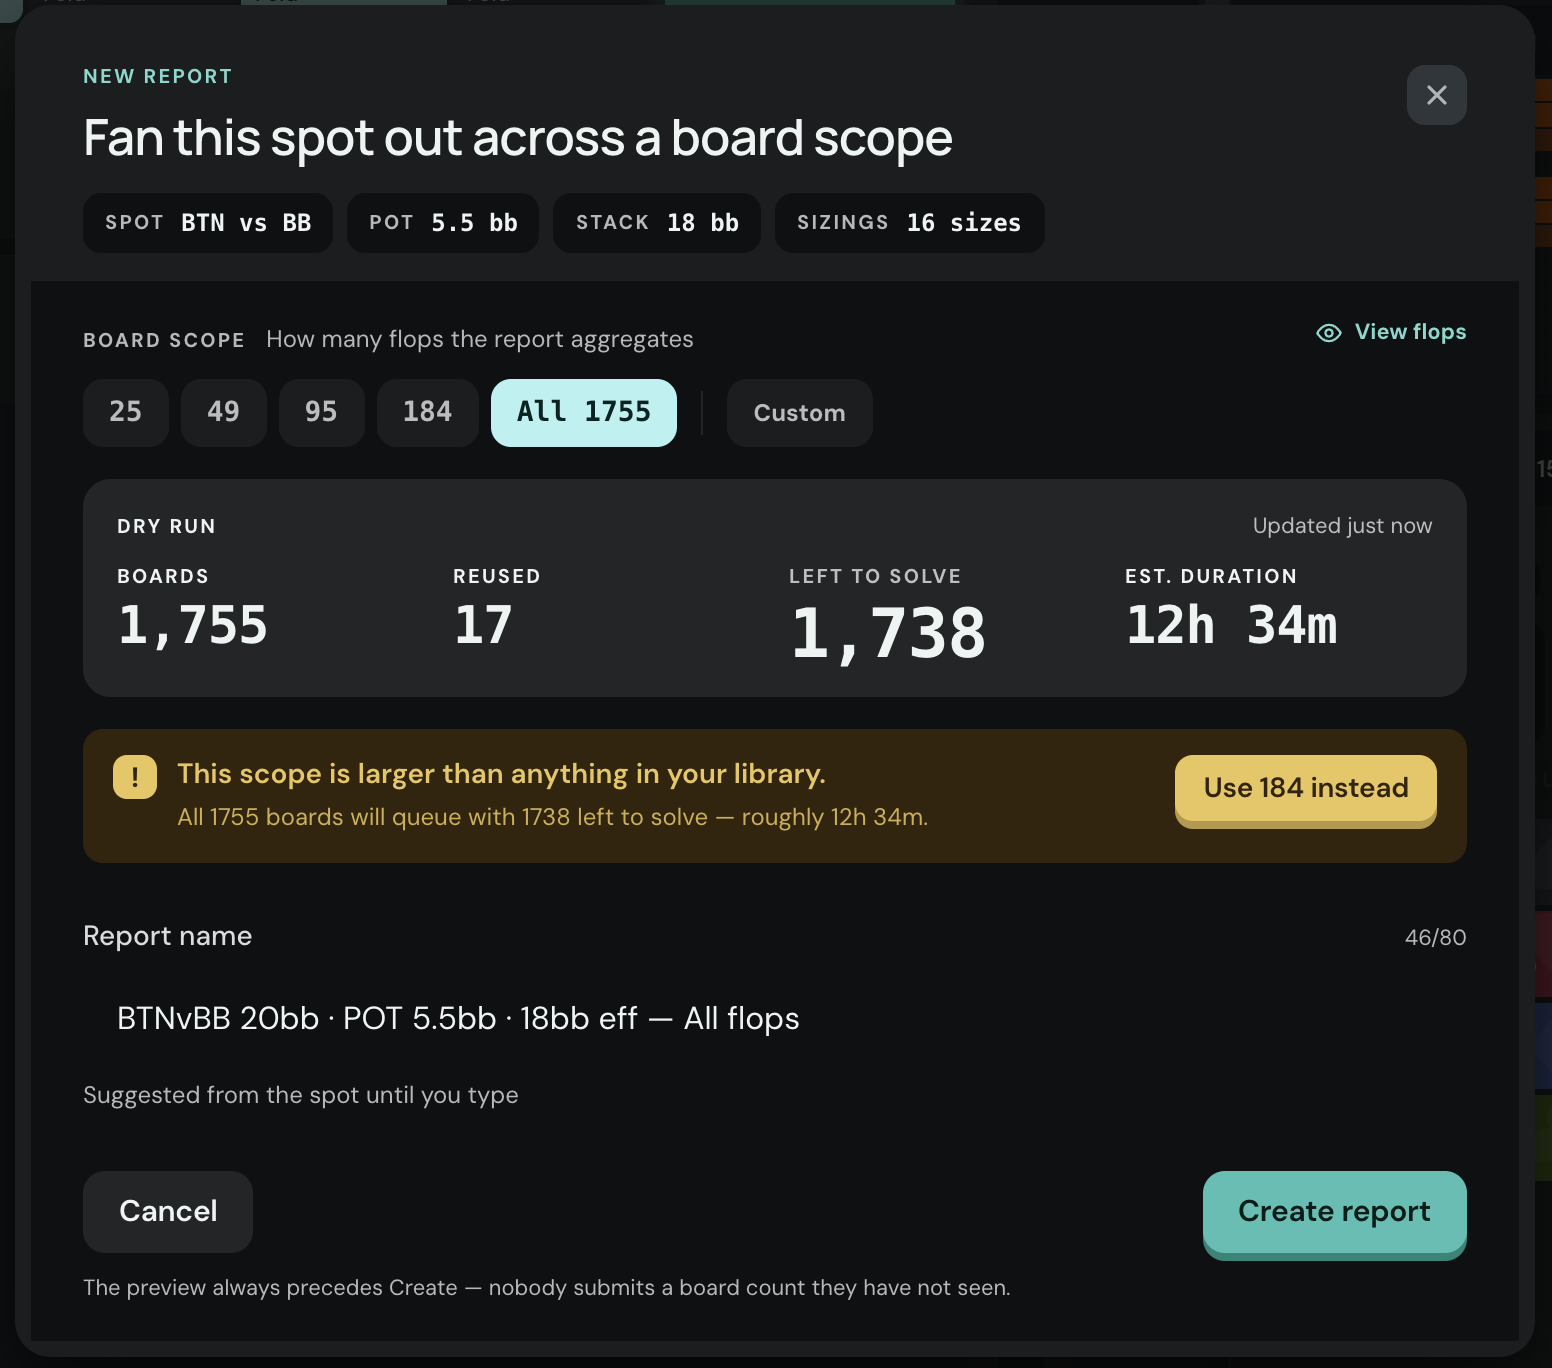
Each flop carries a weight – how many real deals it stands for – so every average on the page is weighted, never a plain mean.
The table
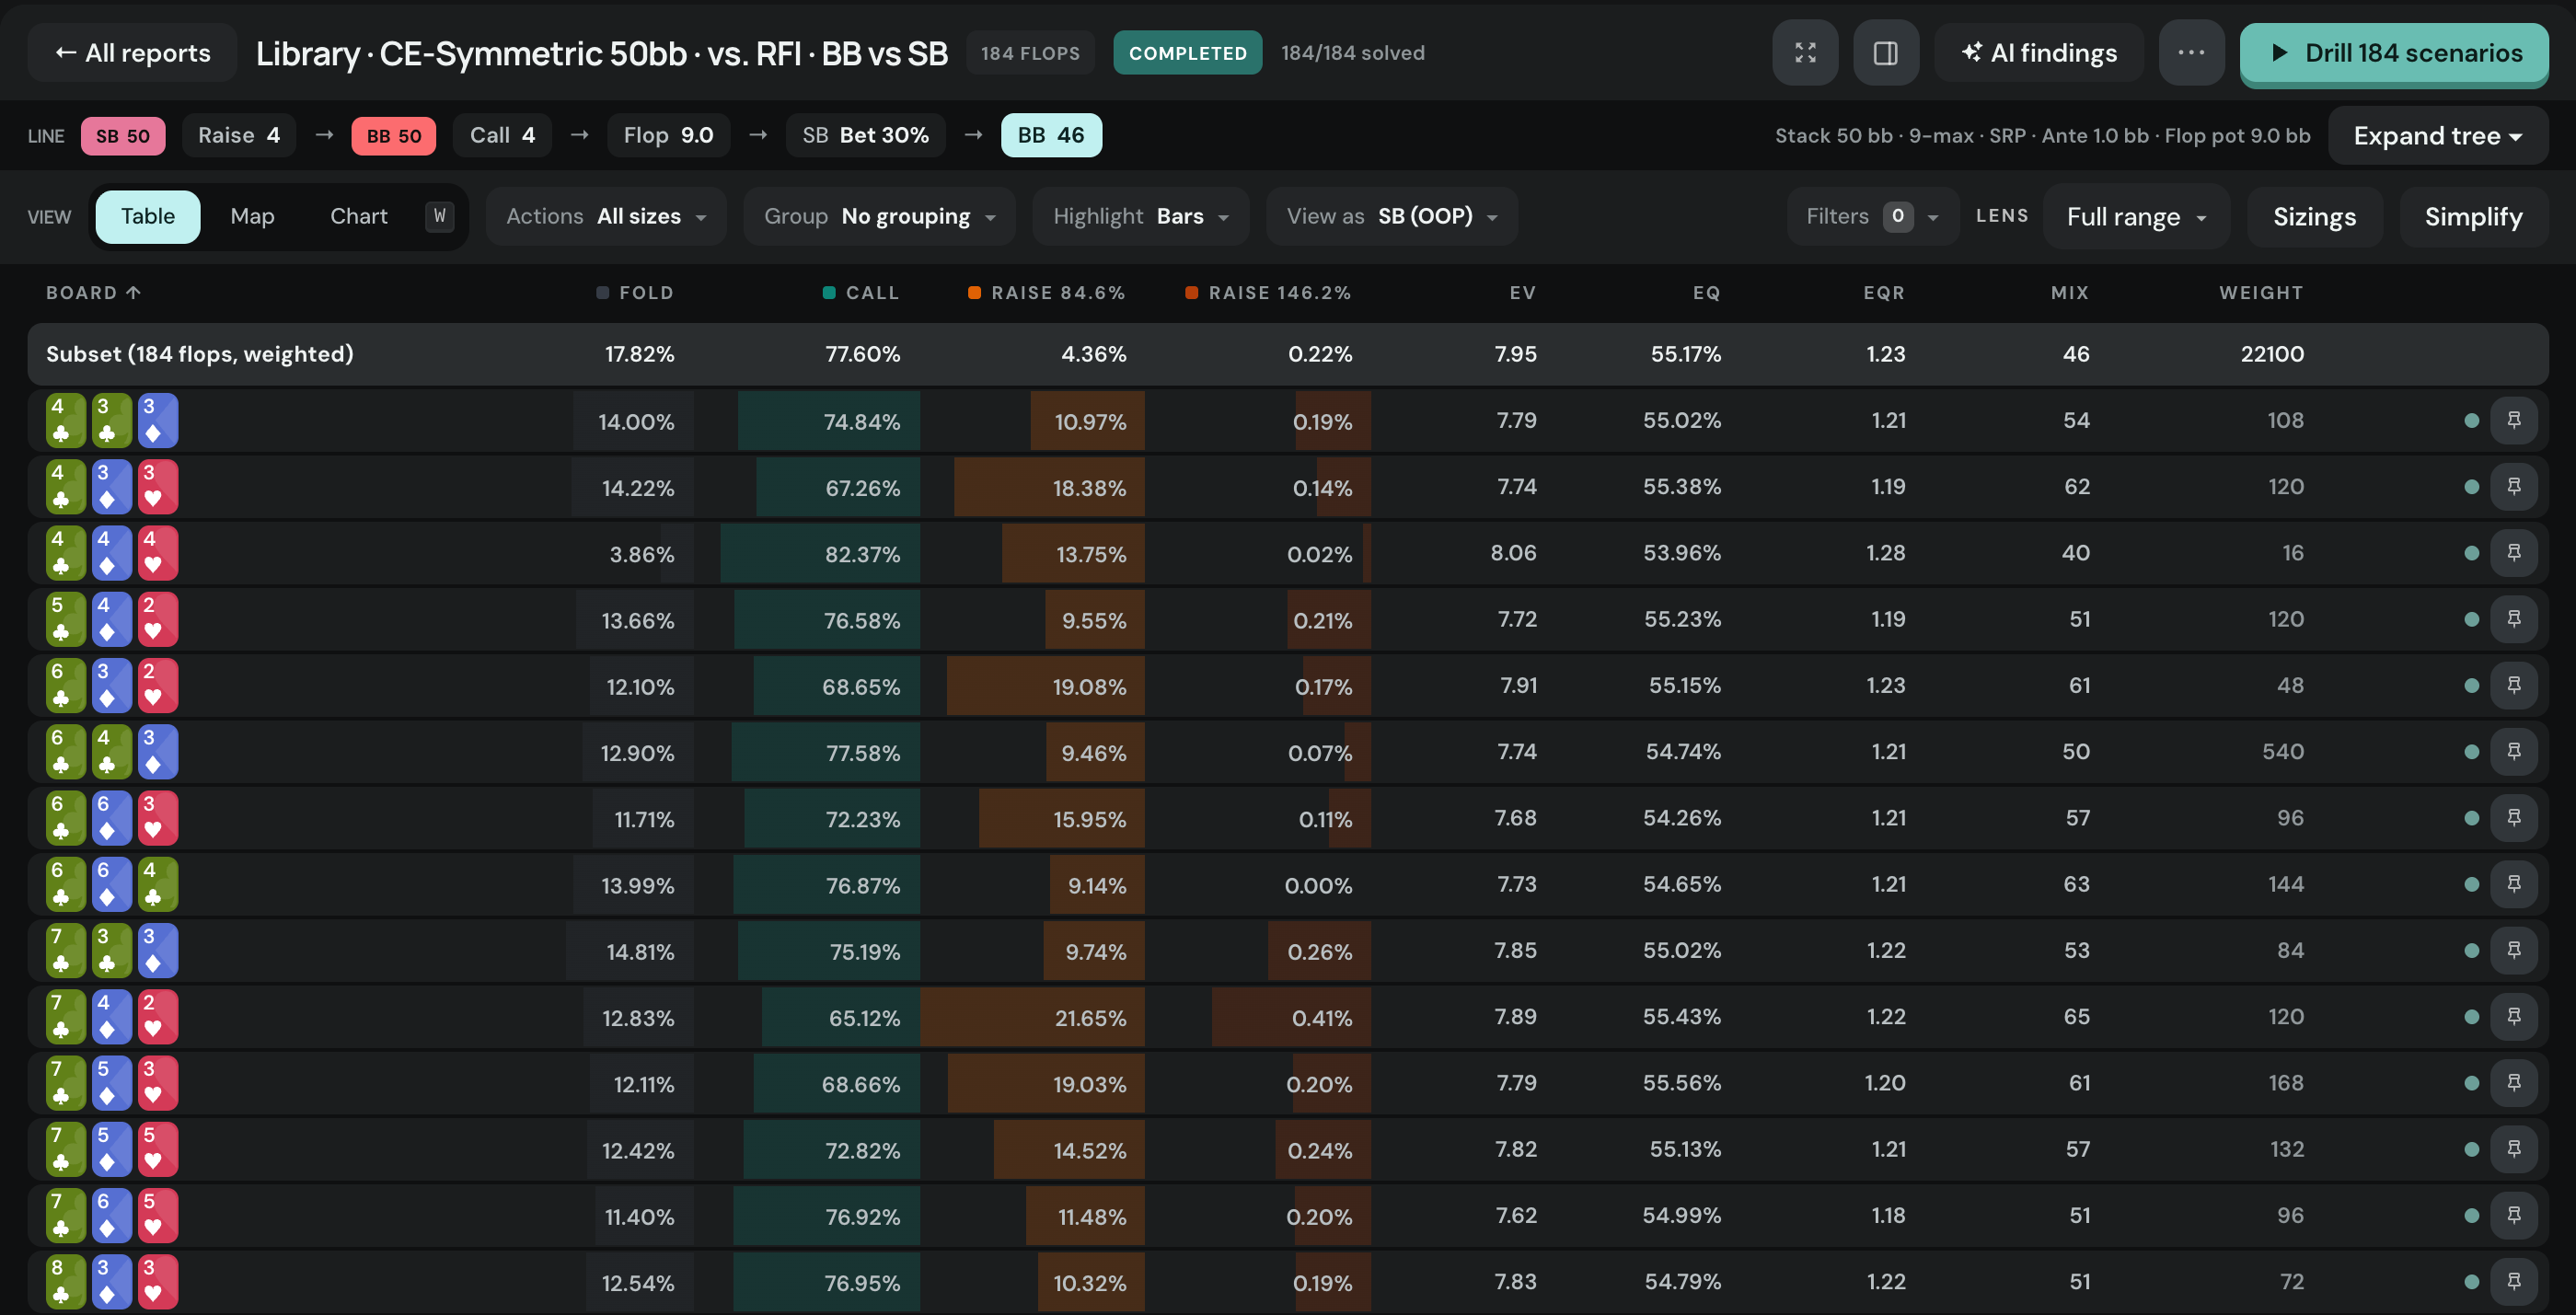
50 bb, nine-handed, 1 bb ante. Small blind opens to 4, big blind calls. 9 bb in the middle, 46 behind, small blind acts first.
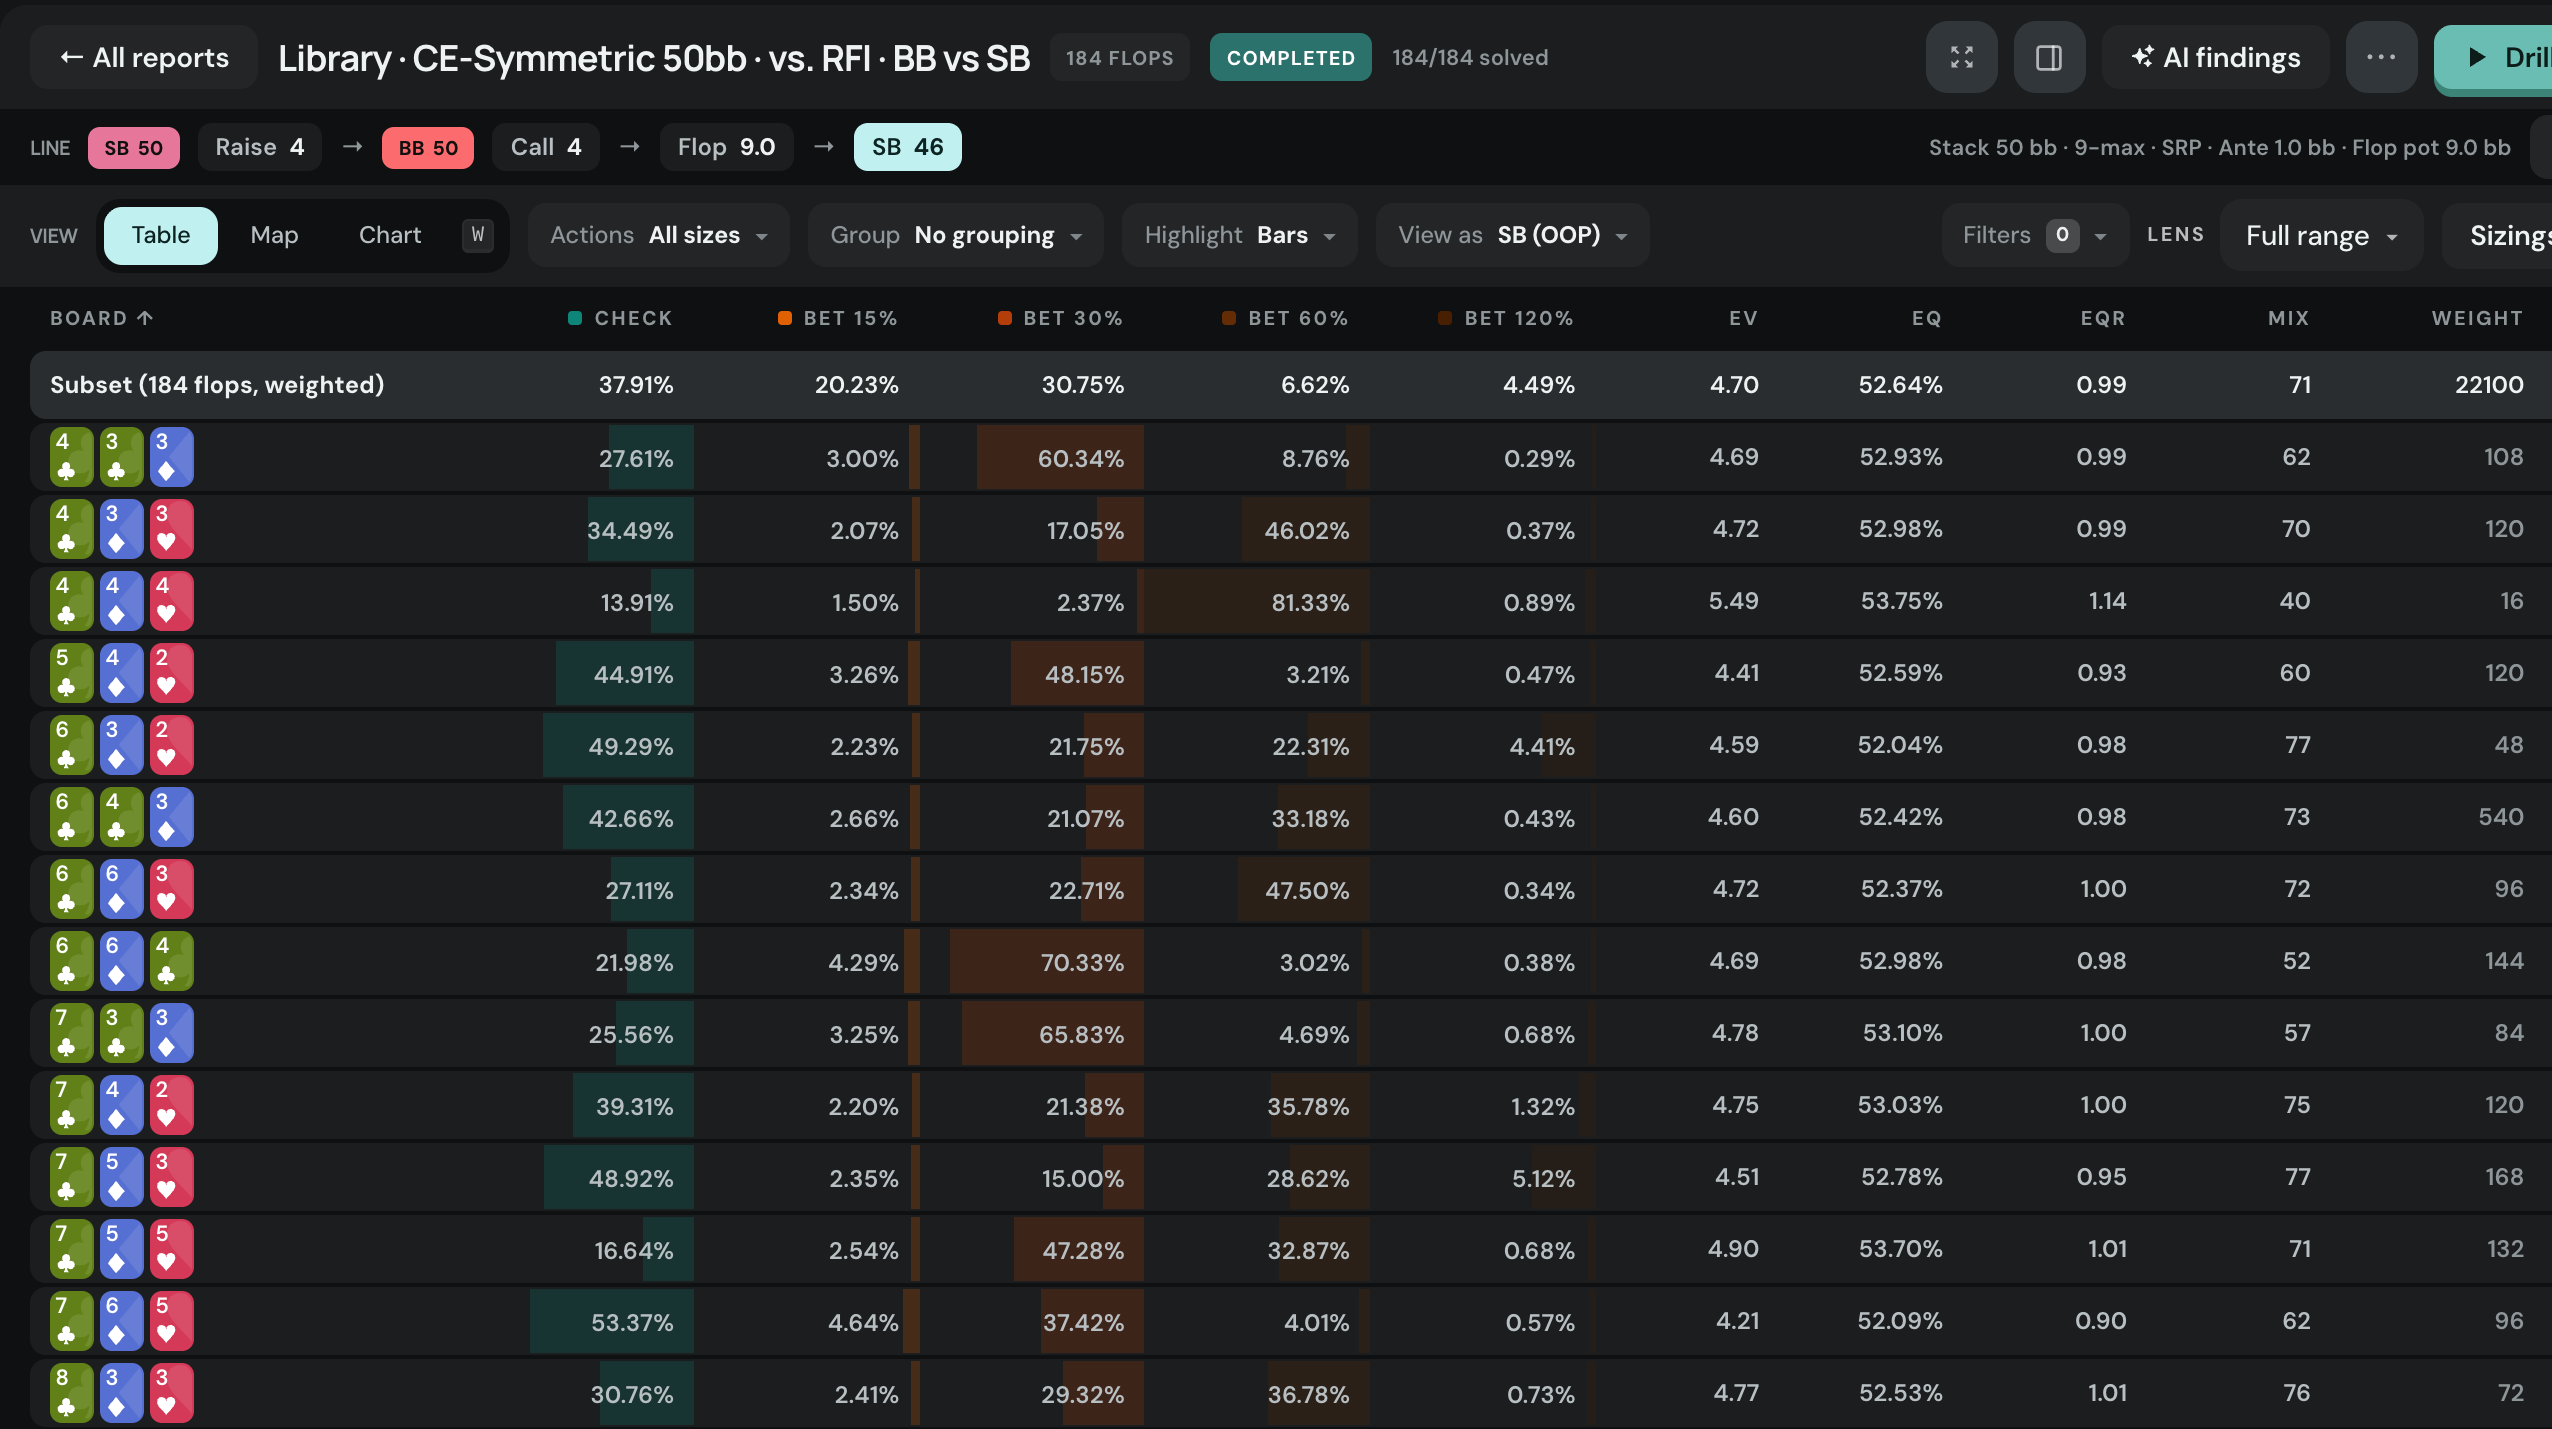
The top row is the rule: check 37.9%, bet 15% pot 20.2%, bet 30% 30.8%, bet 60% 6.6%, overbet 120% 4.5%. The rows show where it breaks: on 4♣4♦4♥ the 60% bet jumps to 81.3%. Click a row and the board panel deals that flop on a felt, with its own numbers next to the average and a button to drill it.
Walk the tree
The action line is clickable. Press Bet 30% and the whole report re-aggregates one node deeper: big blind facing that bet, on all 184 boards.
Filters and groups
Filters are texture tags, with a count on each one. Groups split the table by high card, pairing, suits or connectivity, one average row per group.
Play this spot instead of reading about it
Start Free TrialThe trainer deals the situations this article describes and grades every decision you make. Try it free for 3 days.
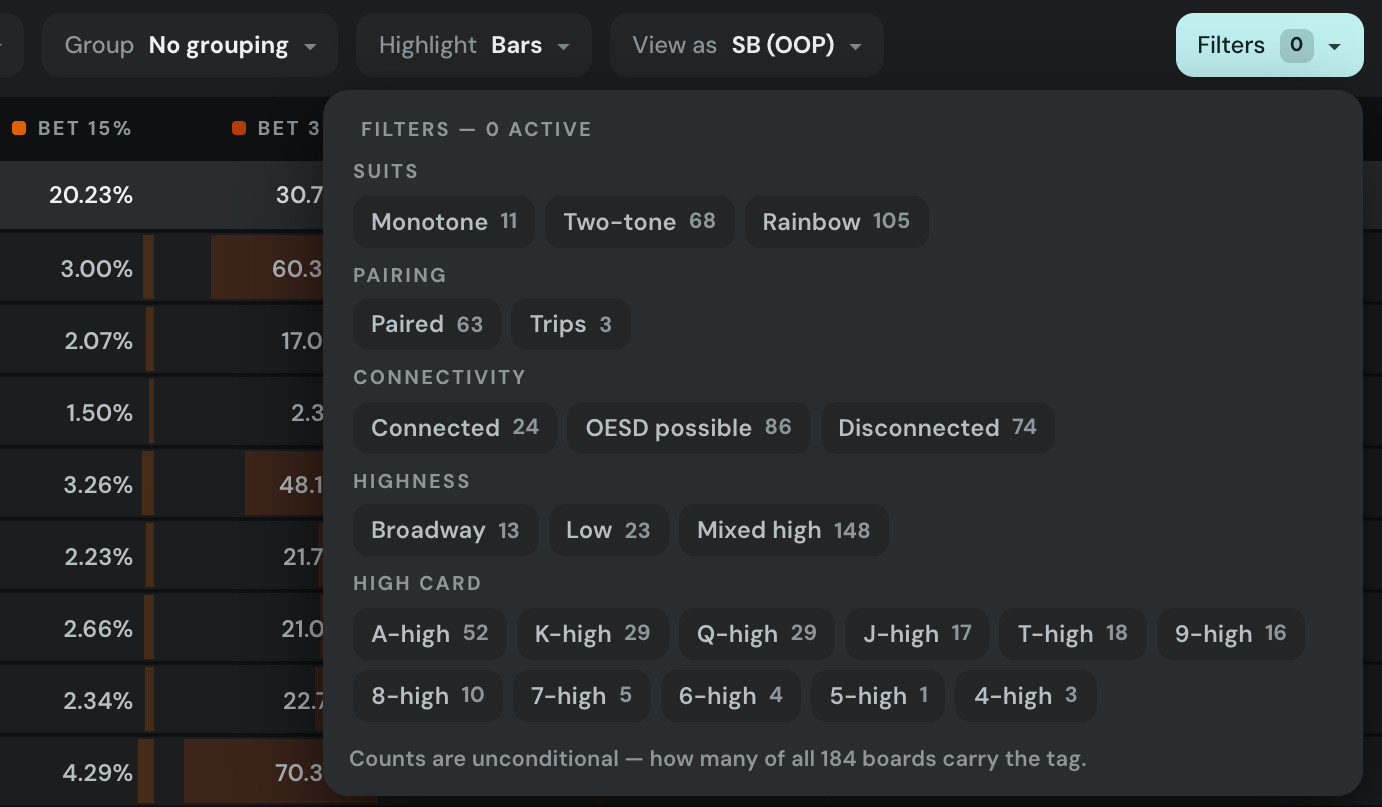
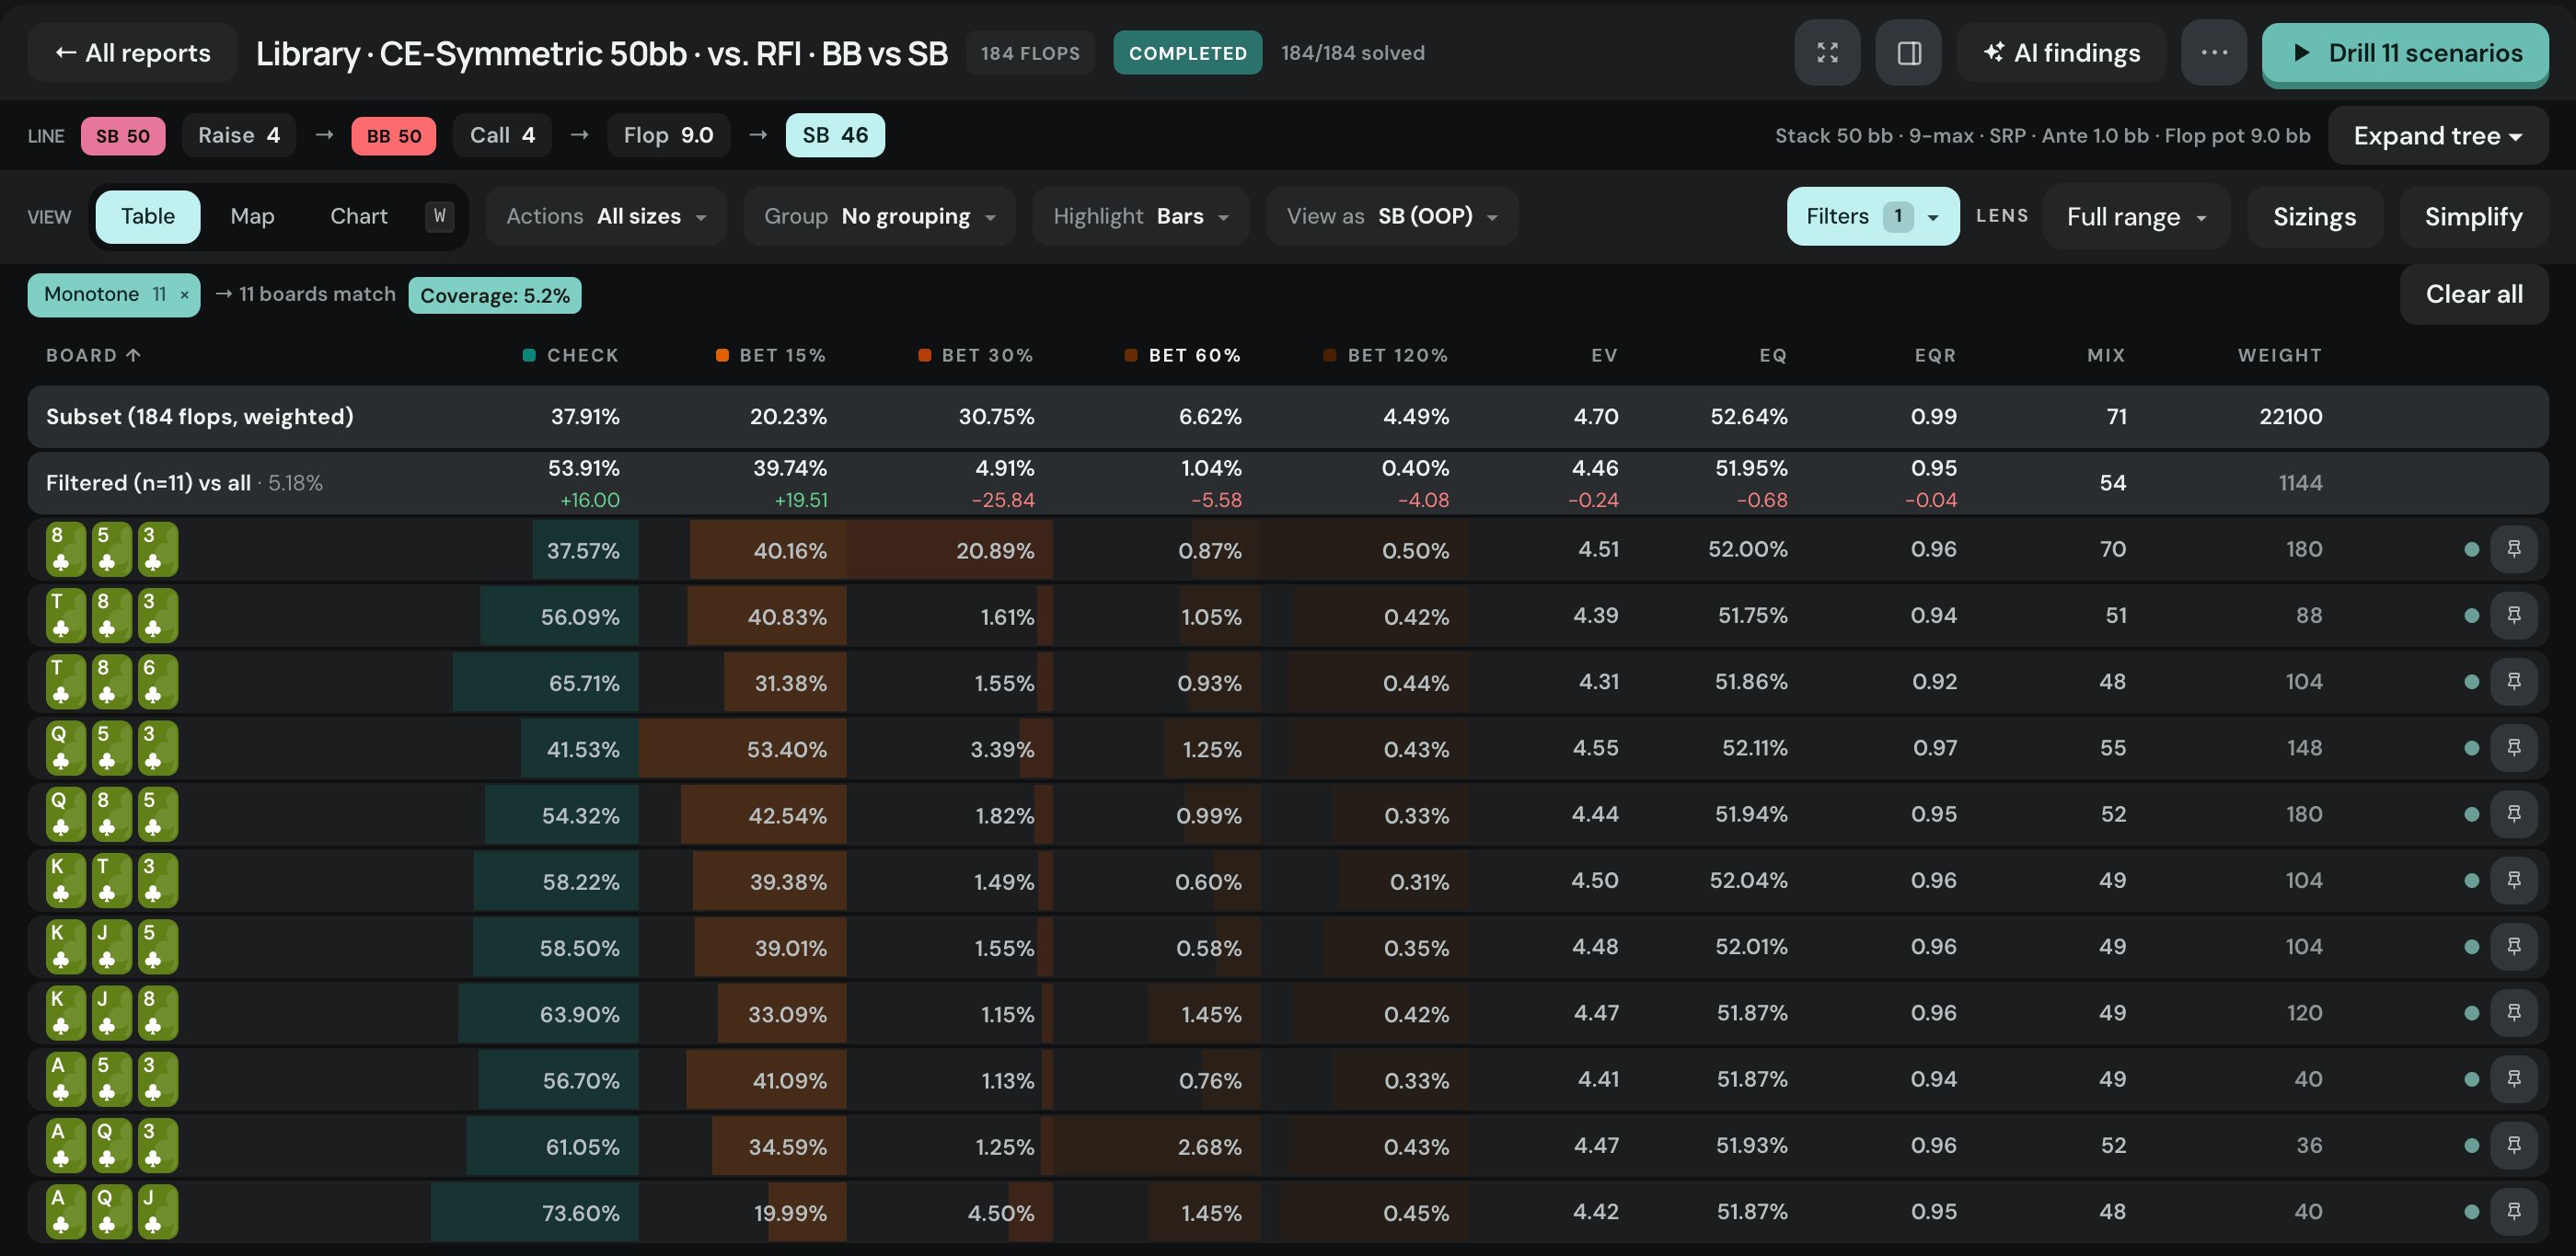
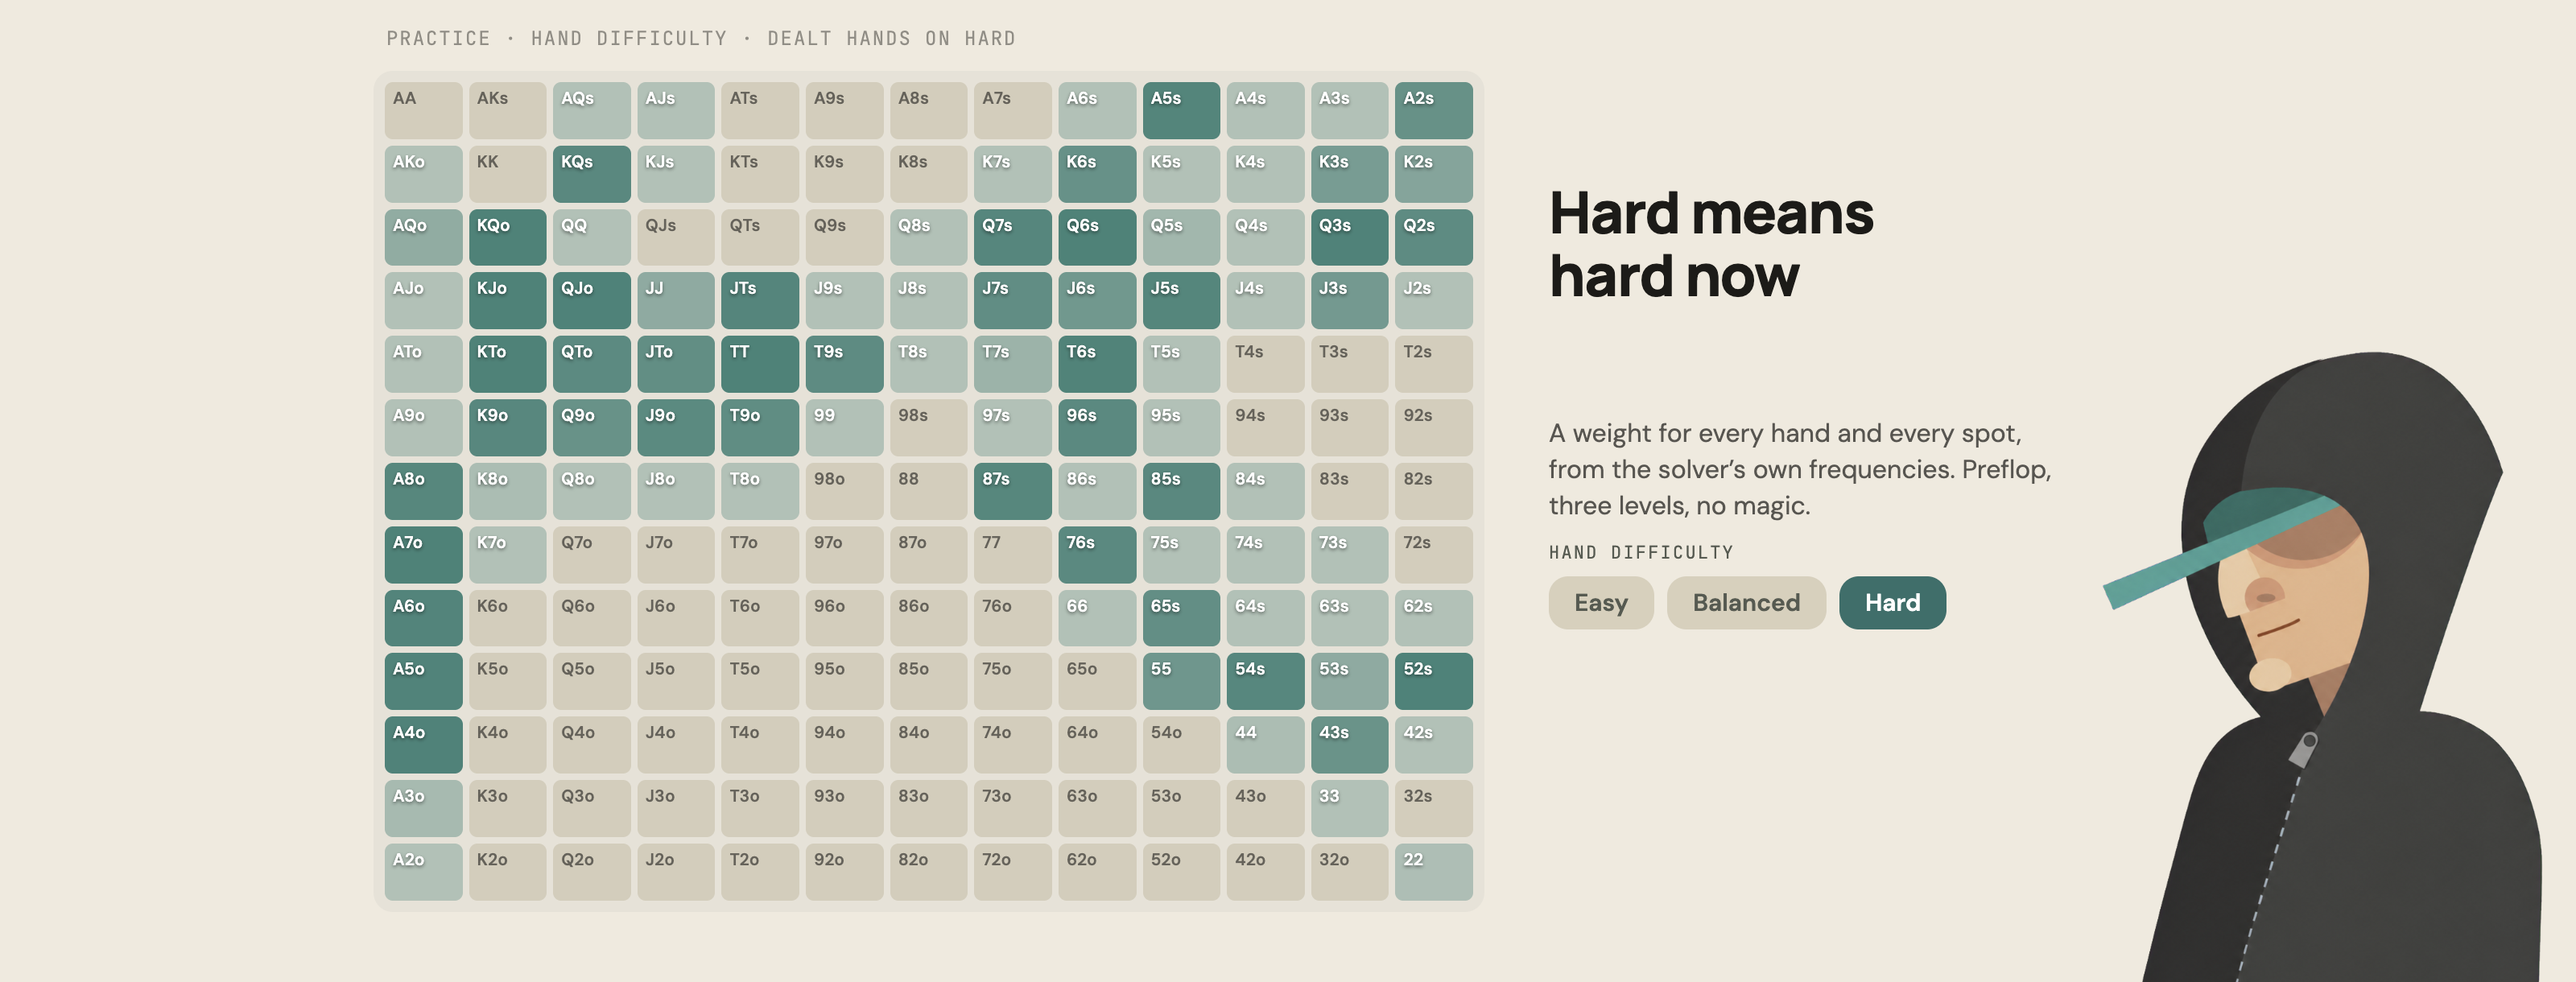
On monotone flops the small blind checks 53.9%, sixteen points more than average, and the 30% bet collapses from 30.8% to 4.9%. Slow down, size down. The map at the top of this post is the same data as tiles – check frequency, lighter is more checking.
The chart
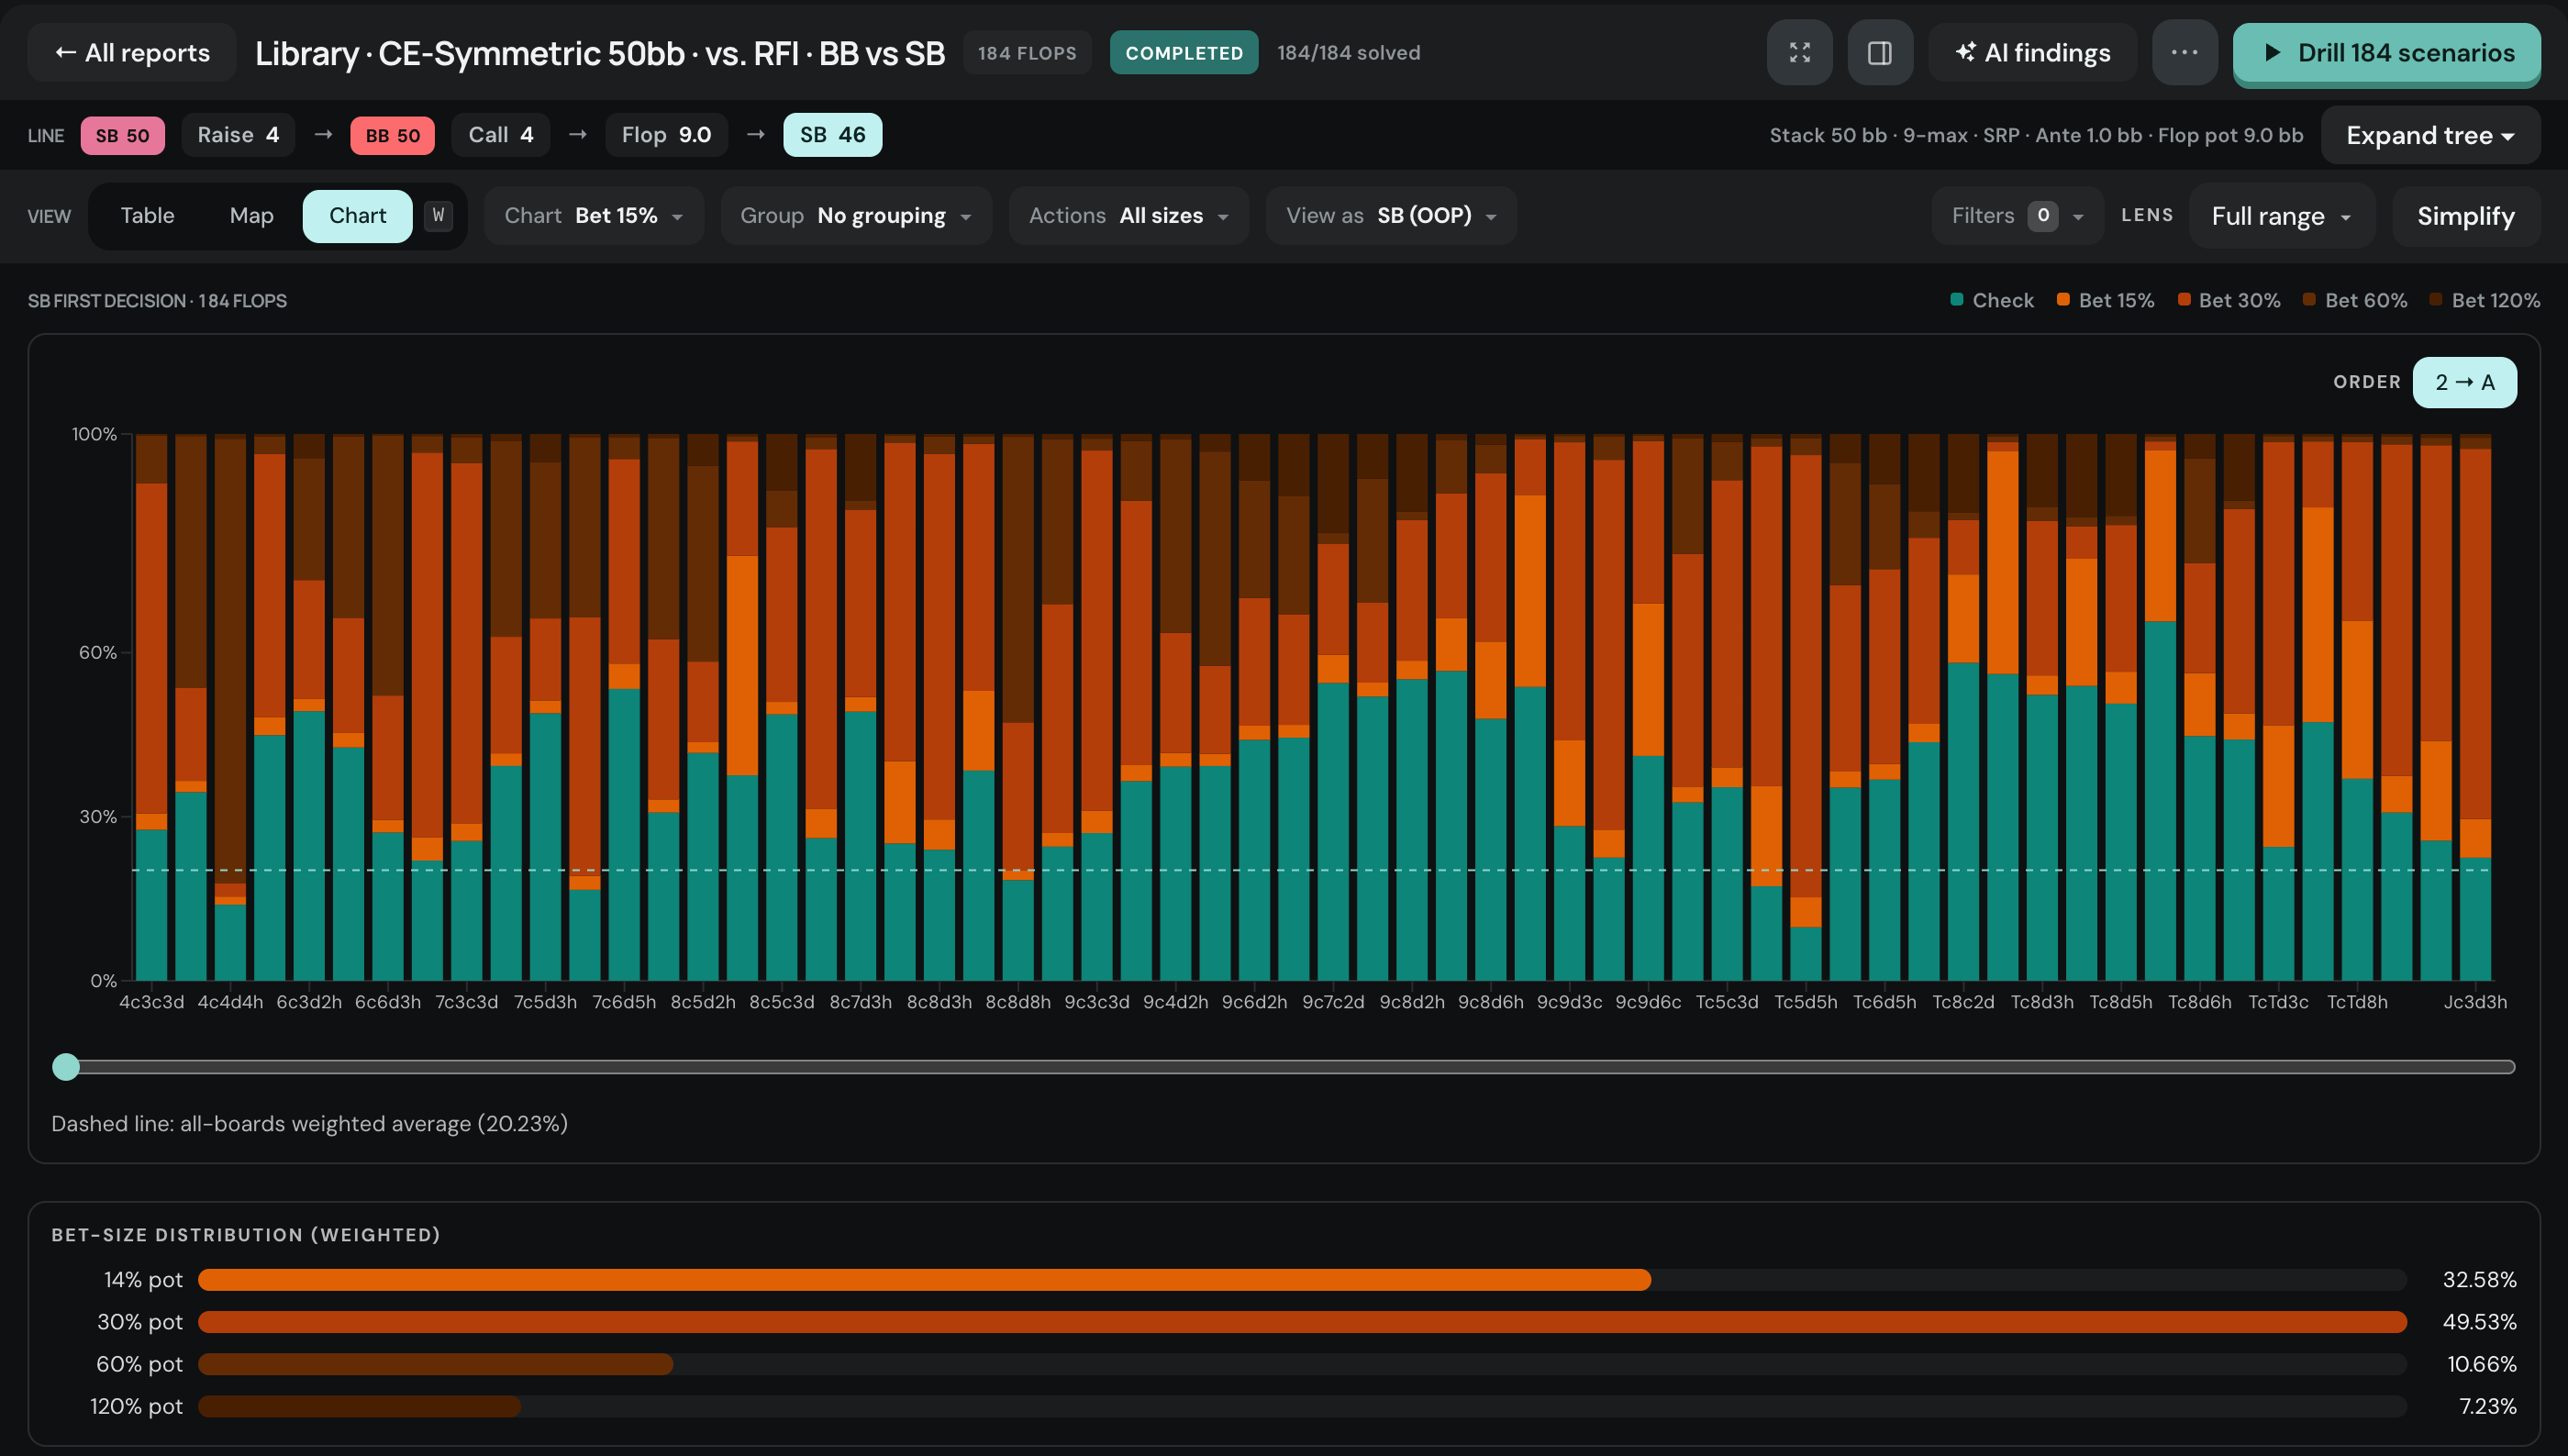
Chart view stacks every board’s first decision as one bar, in the order the boards appear in the table. The dashed line is the weighted average of the action you pick, so the boards above and below it jump out.
Lenses
A lens reads the whole report through one hand class – made hands, draws, detailed classes, or an exact combo.
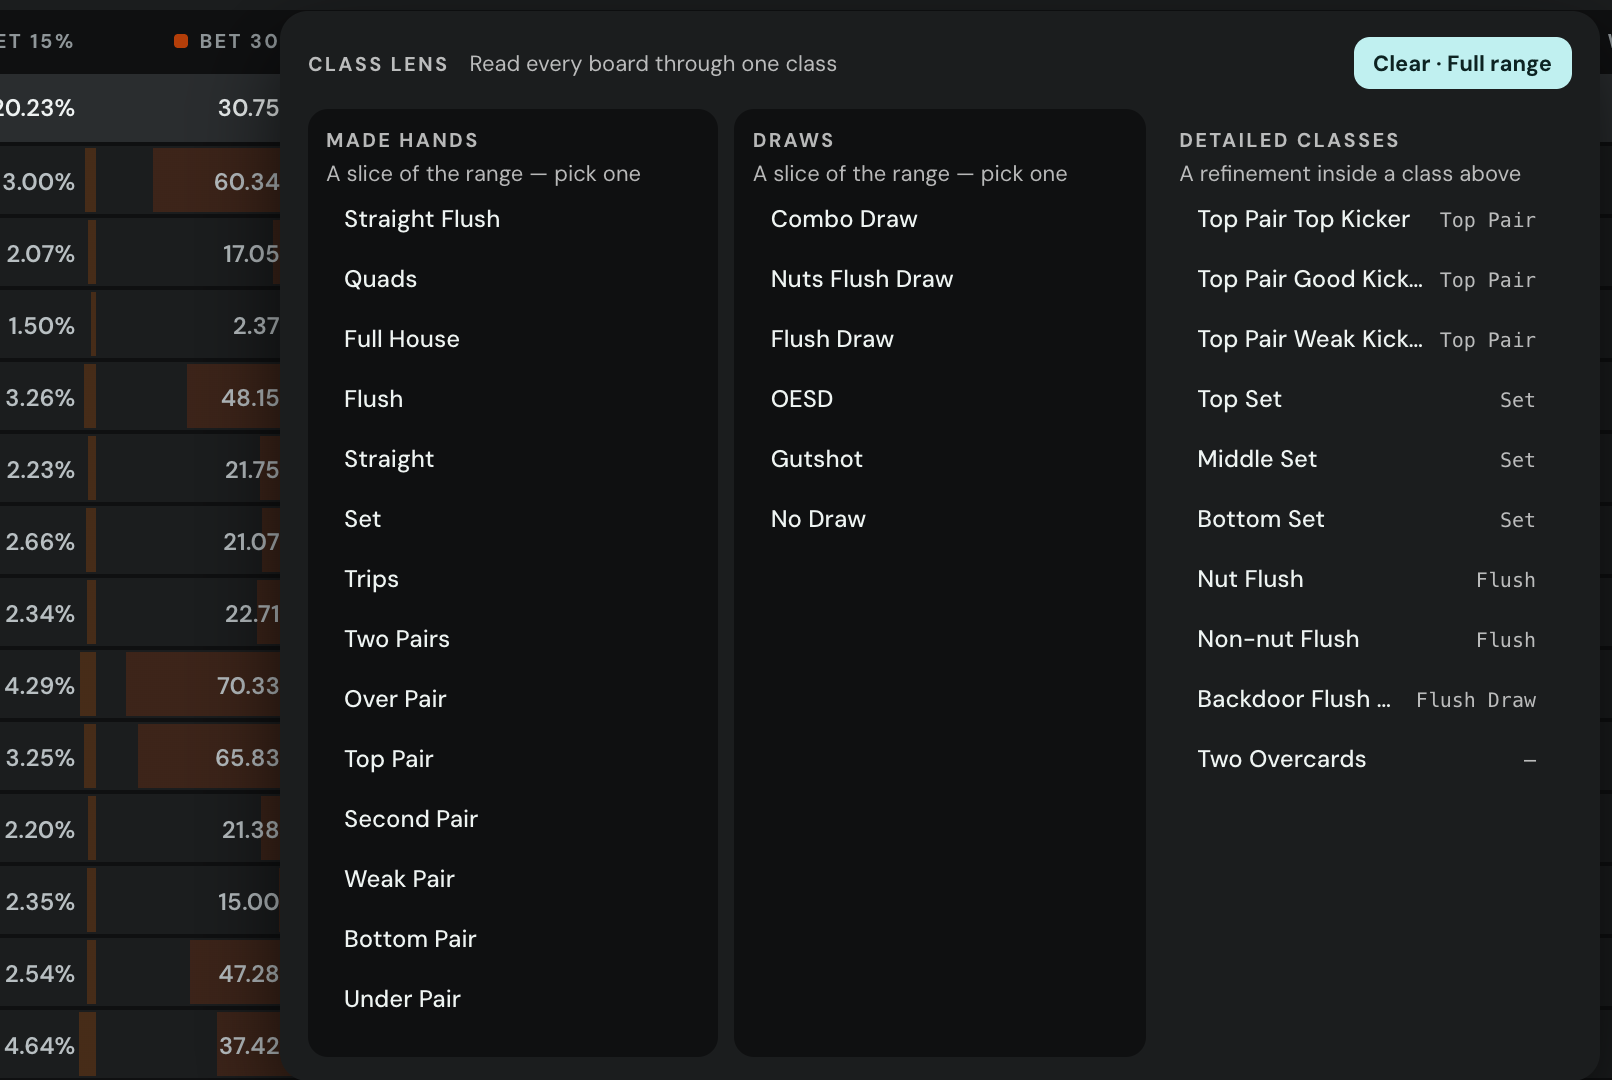
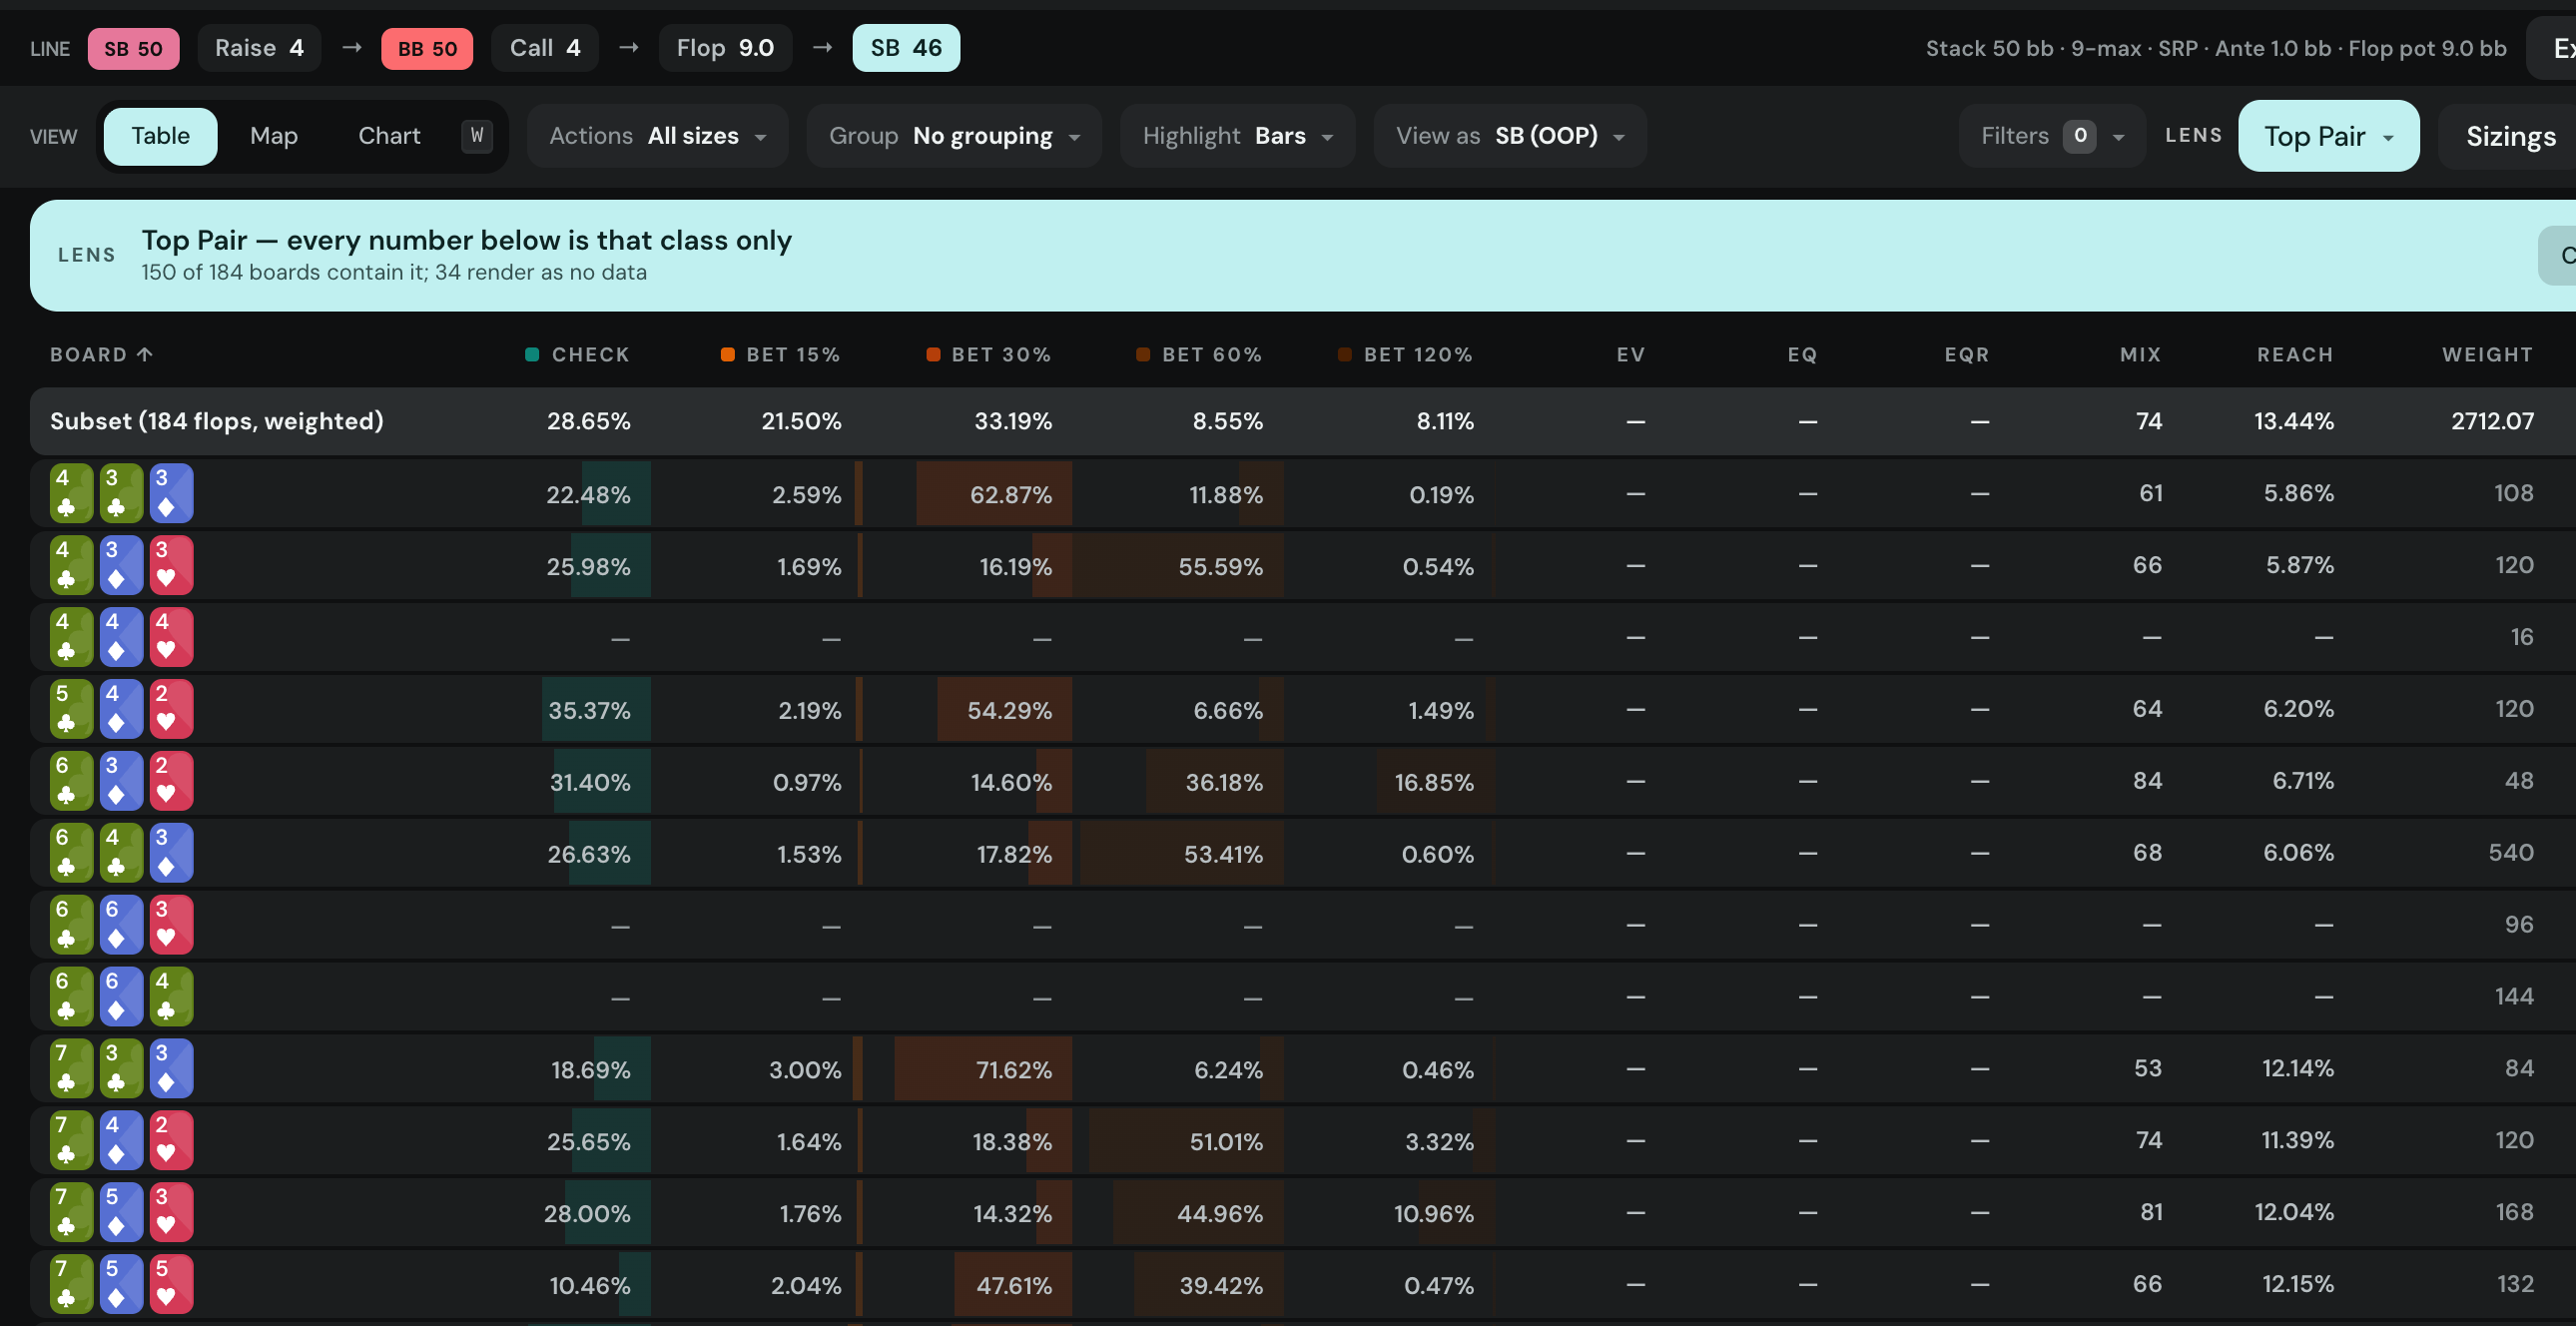
With top pair the check drops to 28.7% and the overbet goes from 4.5% to 8.1%. Zero is an answer from the solver; “no data” is not, and the app keeps them apart.
What does one size cost?
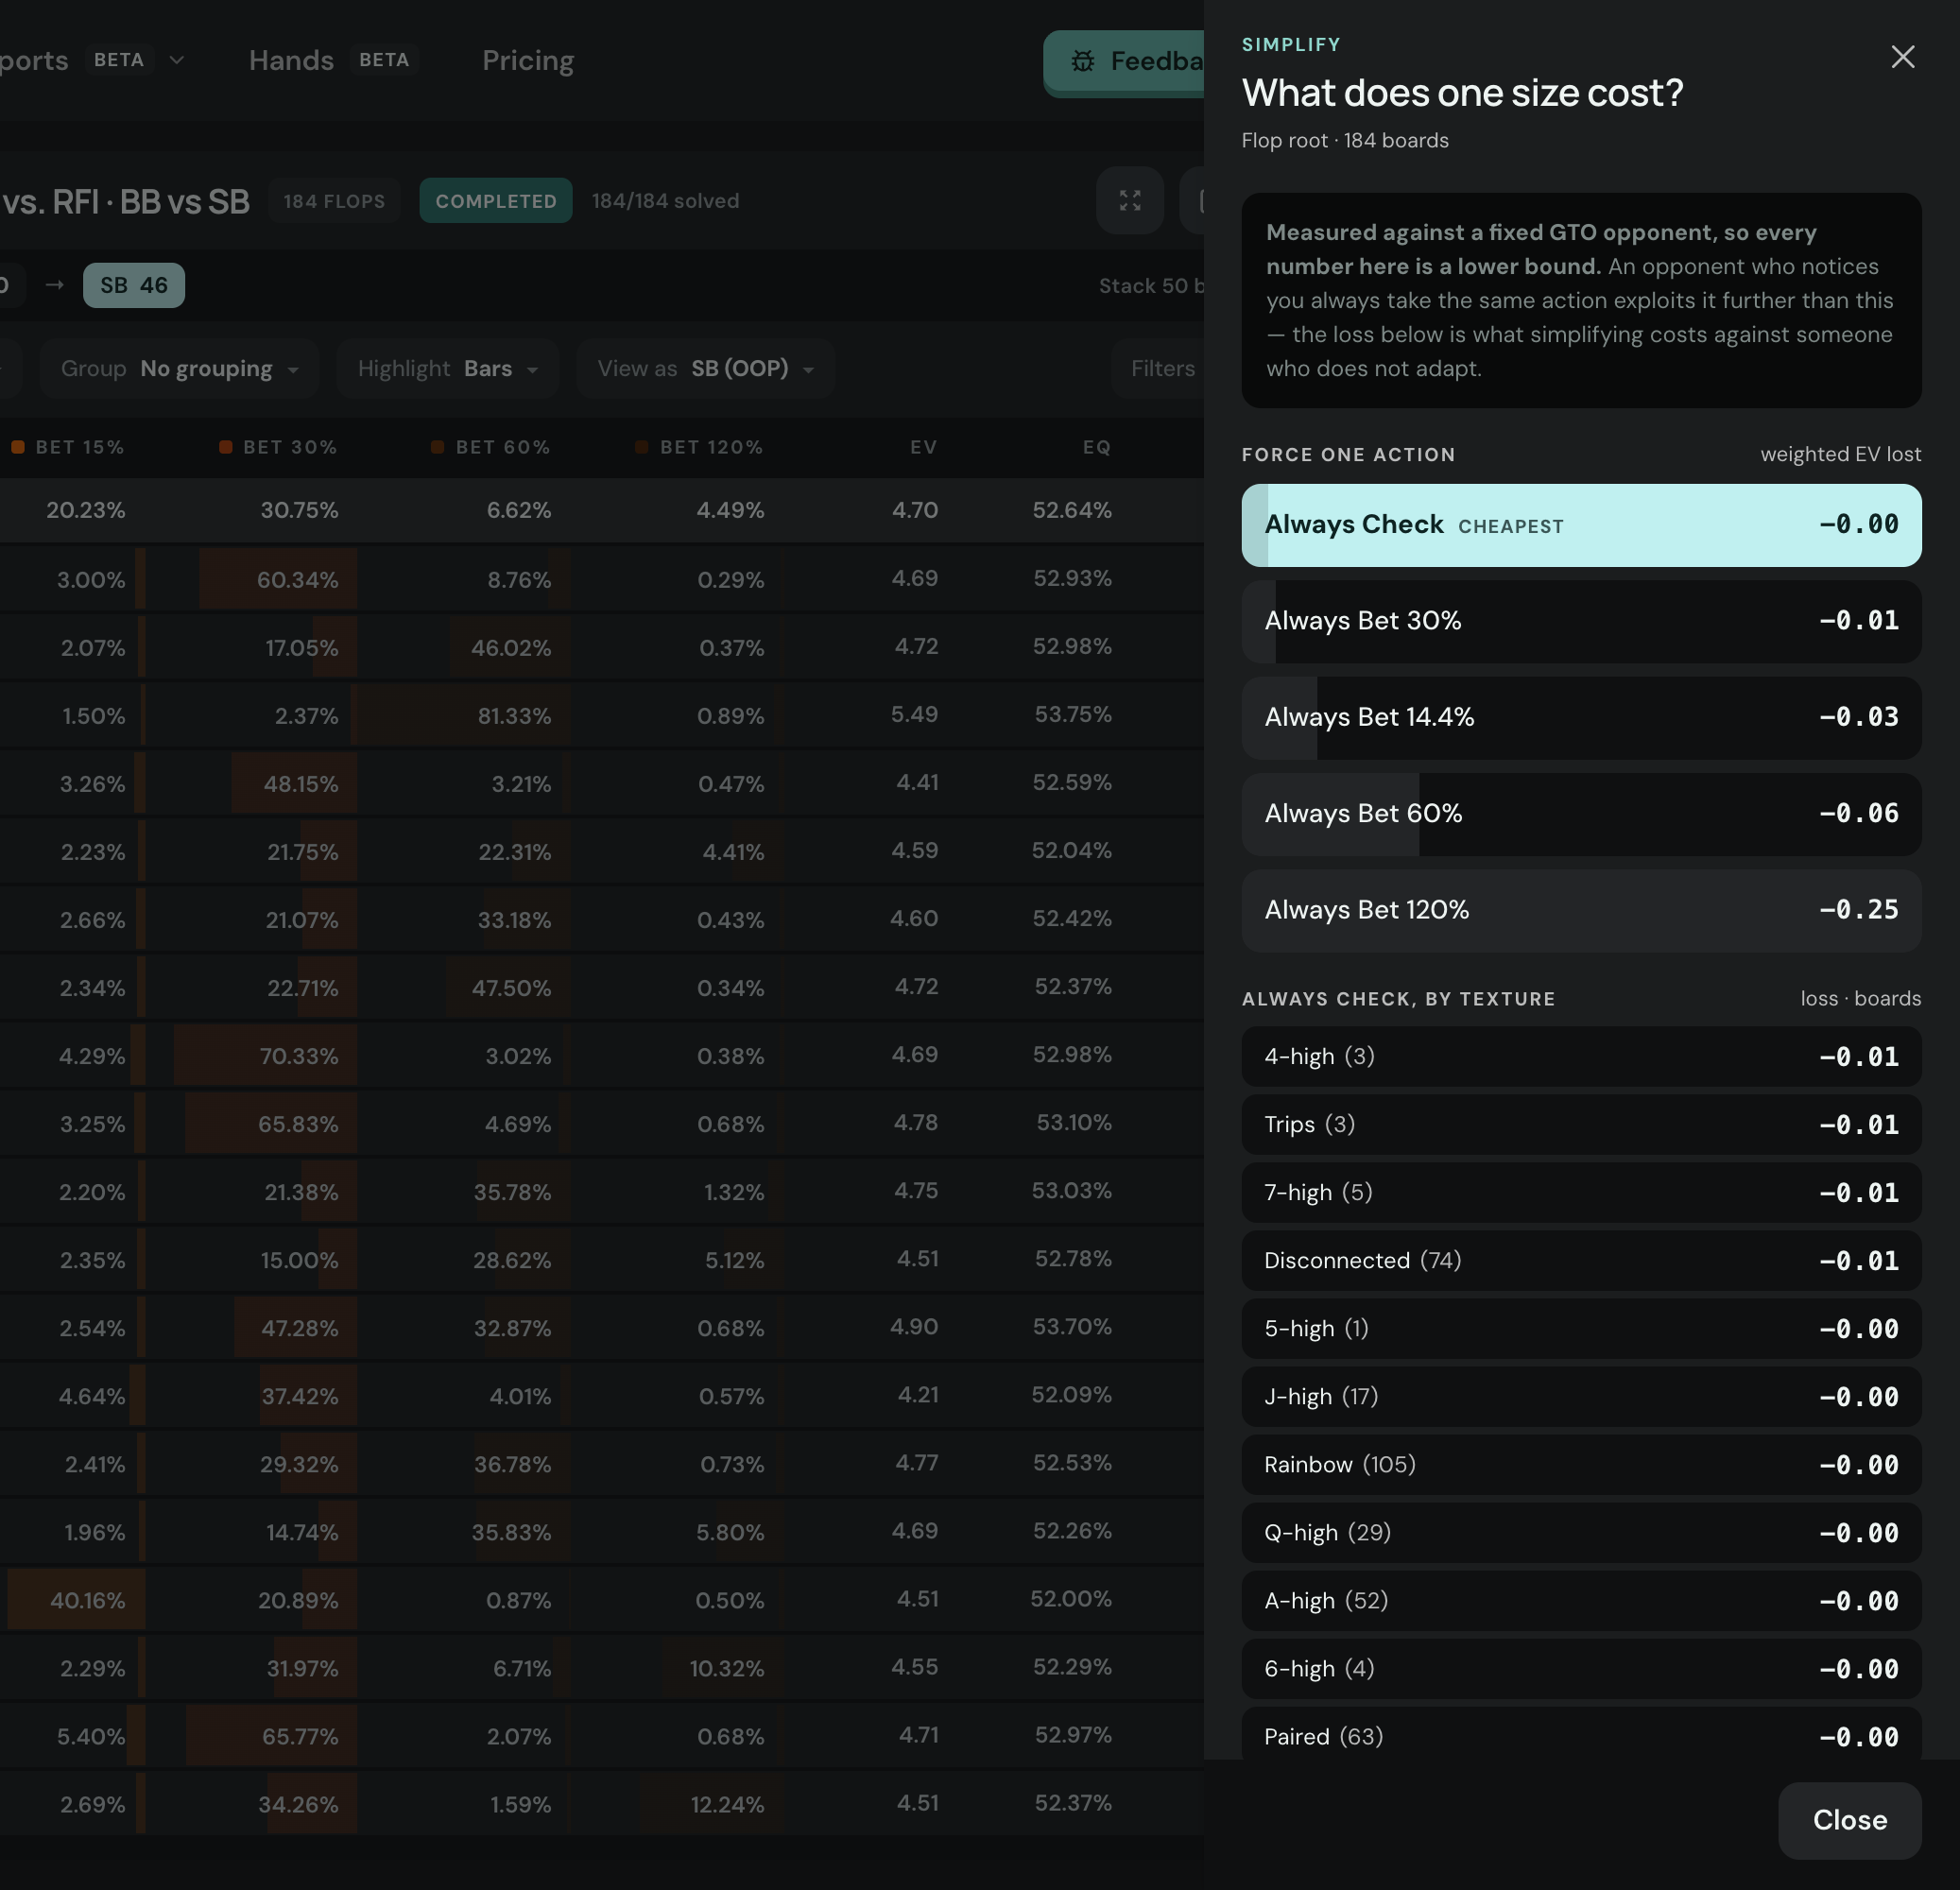
Always checking costs next to nothing here, always betting 30% about 0.01 bb, always overbetting 0.25 bb. Read the caveat: measured against a fixed solver opponent, so every number is a lower bound. A human who notices will make you pay more.
Turn runouts
Flop T♣T♦3♥, button versus big blind at 20 bb. Check, bet 22% pot (1.2 into 5.5), call. 7.9 bb on the turn.
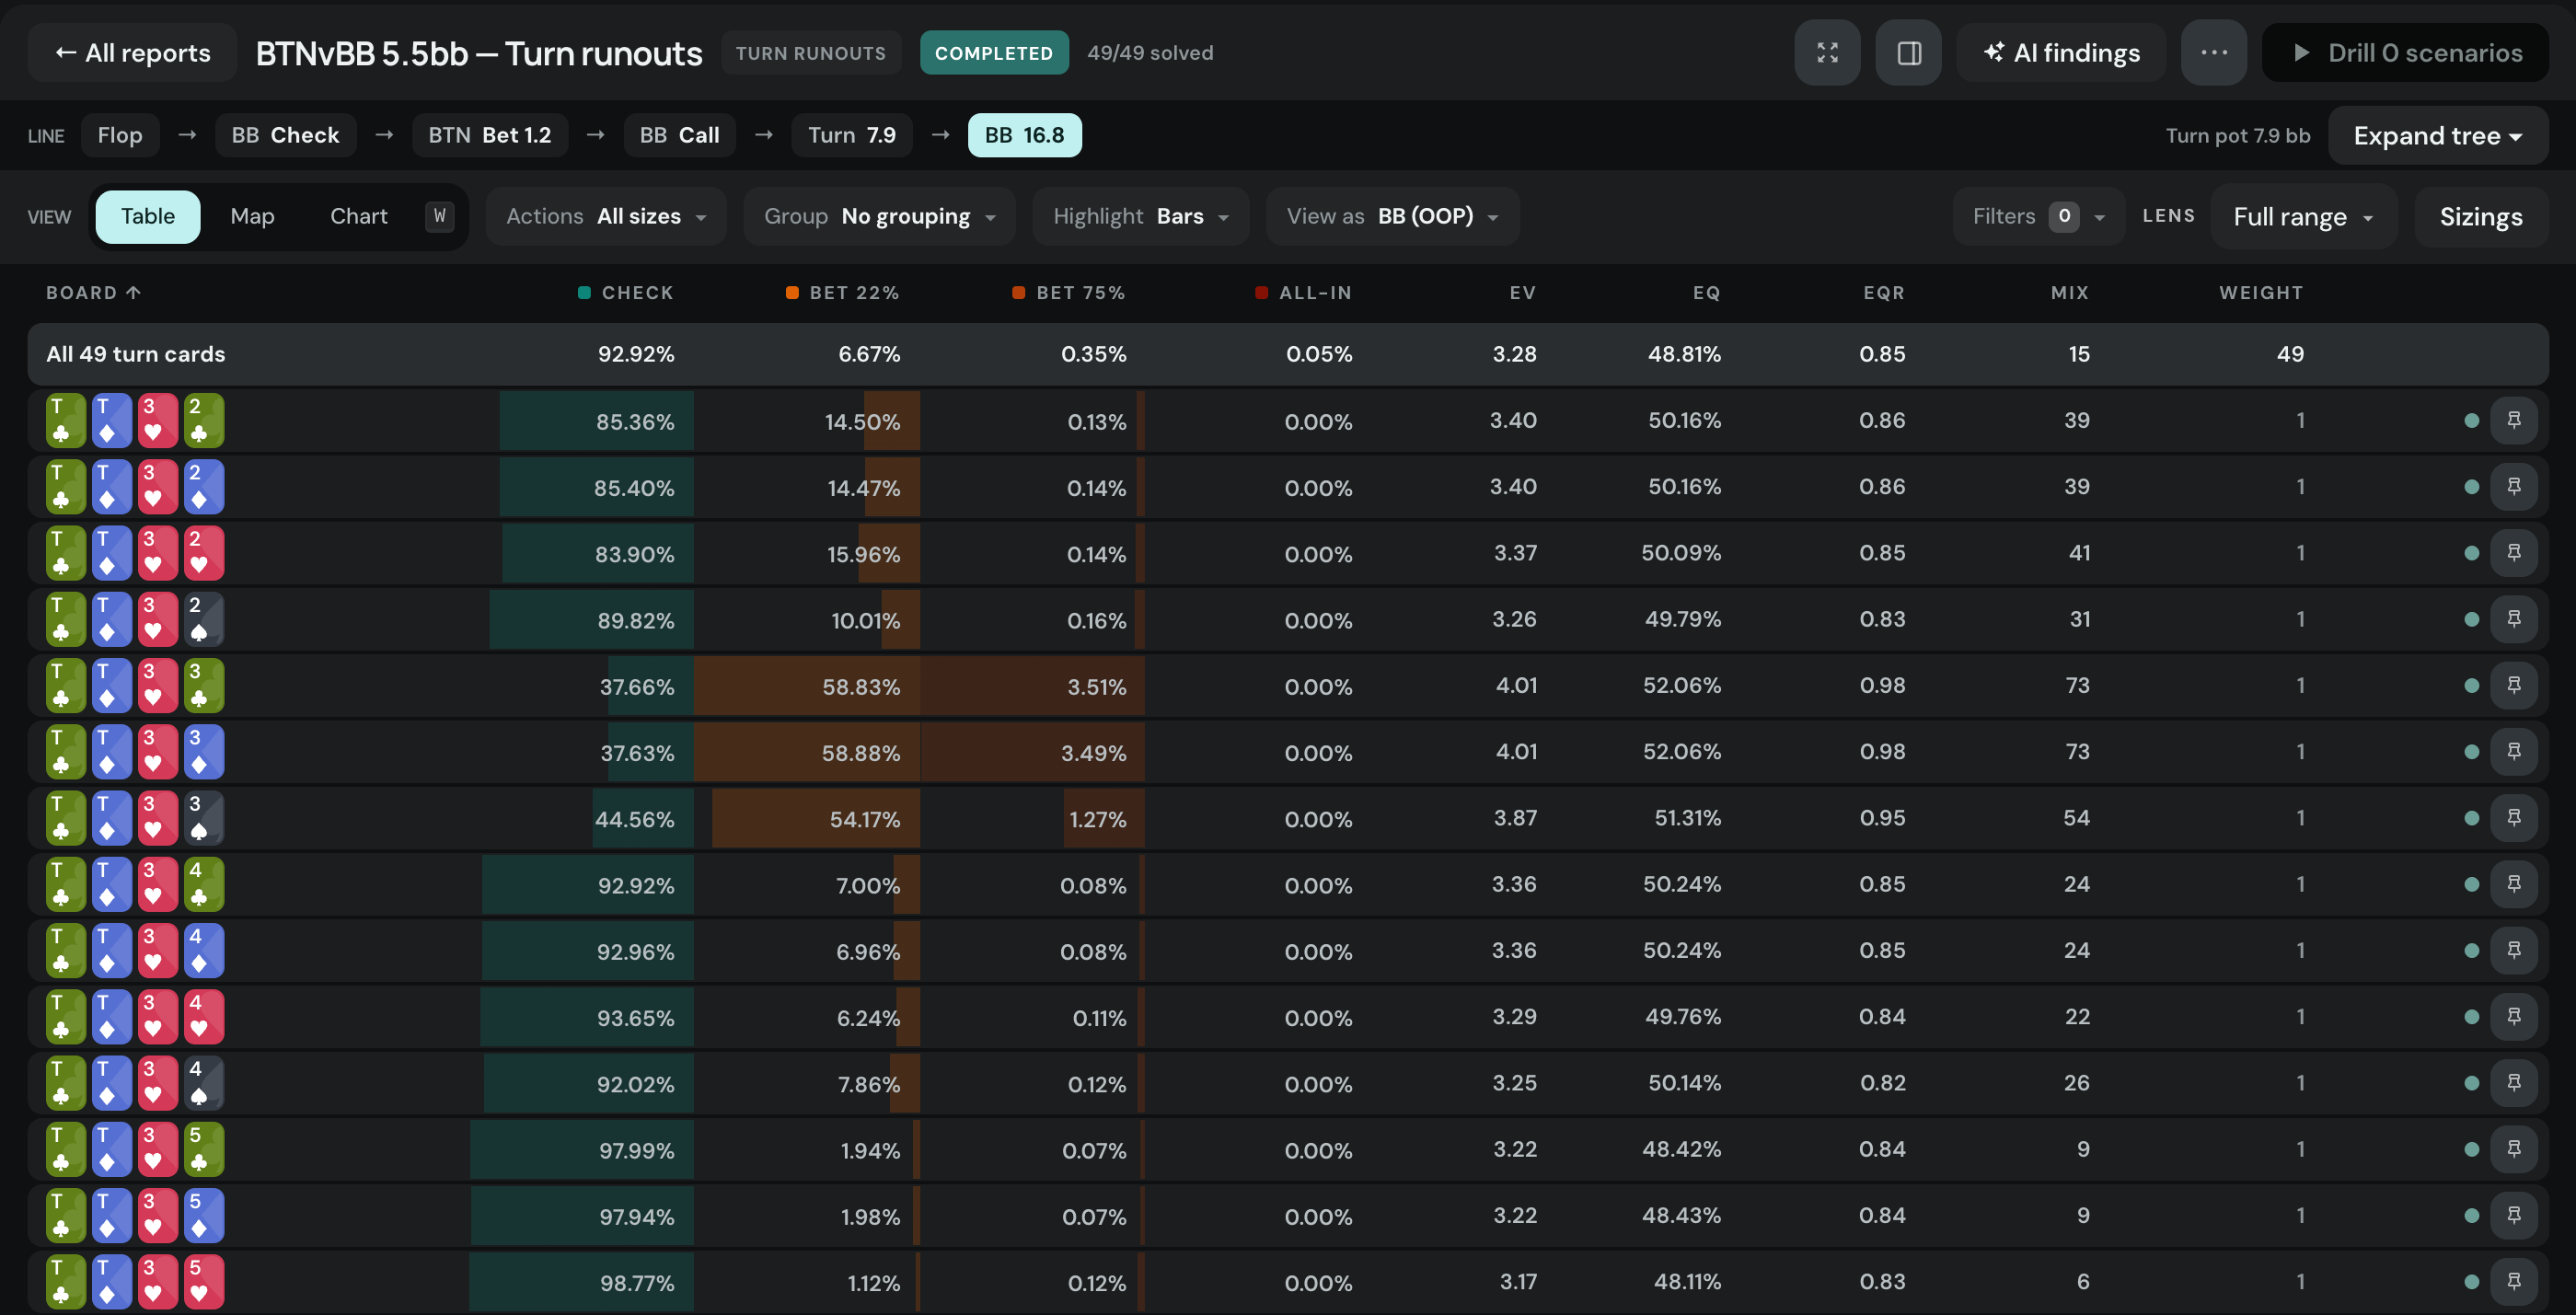
Across all 49 the big blind checks 92.9%. On a 3 the check falls to 37.7% and the small bet jumps to 58.8%. On a blank it stays a check.
Compare reports
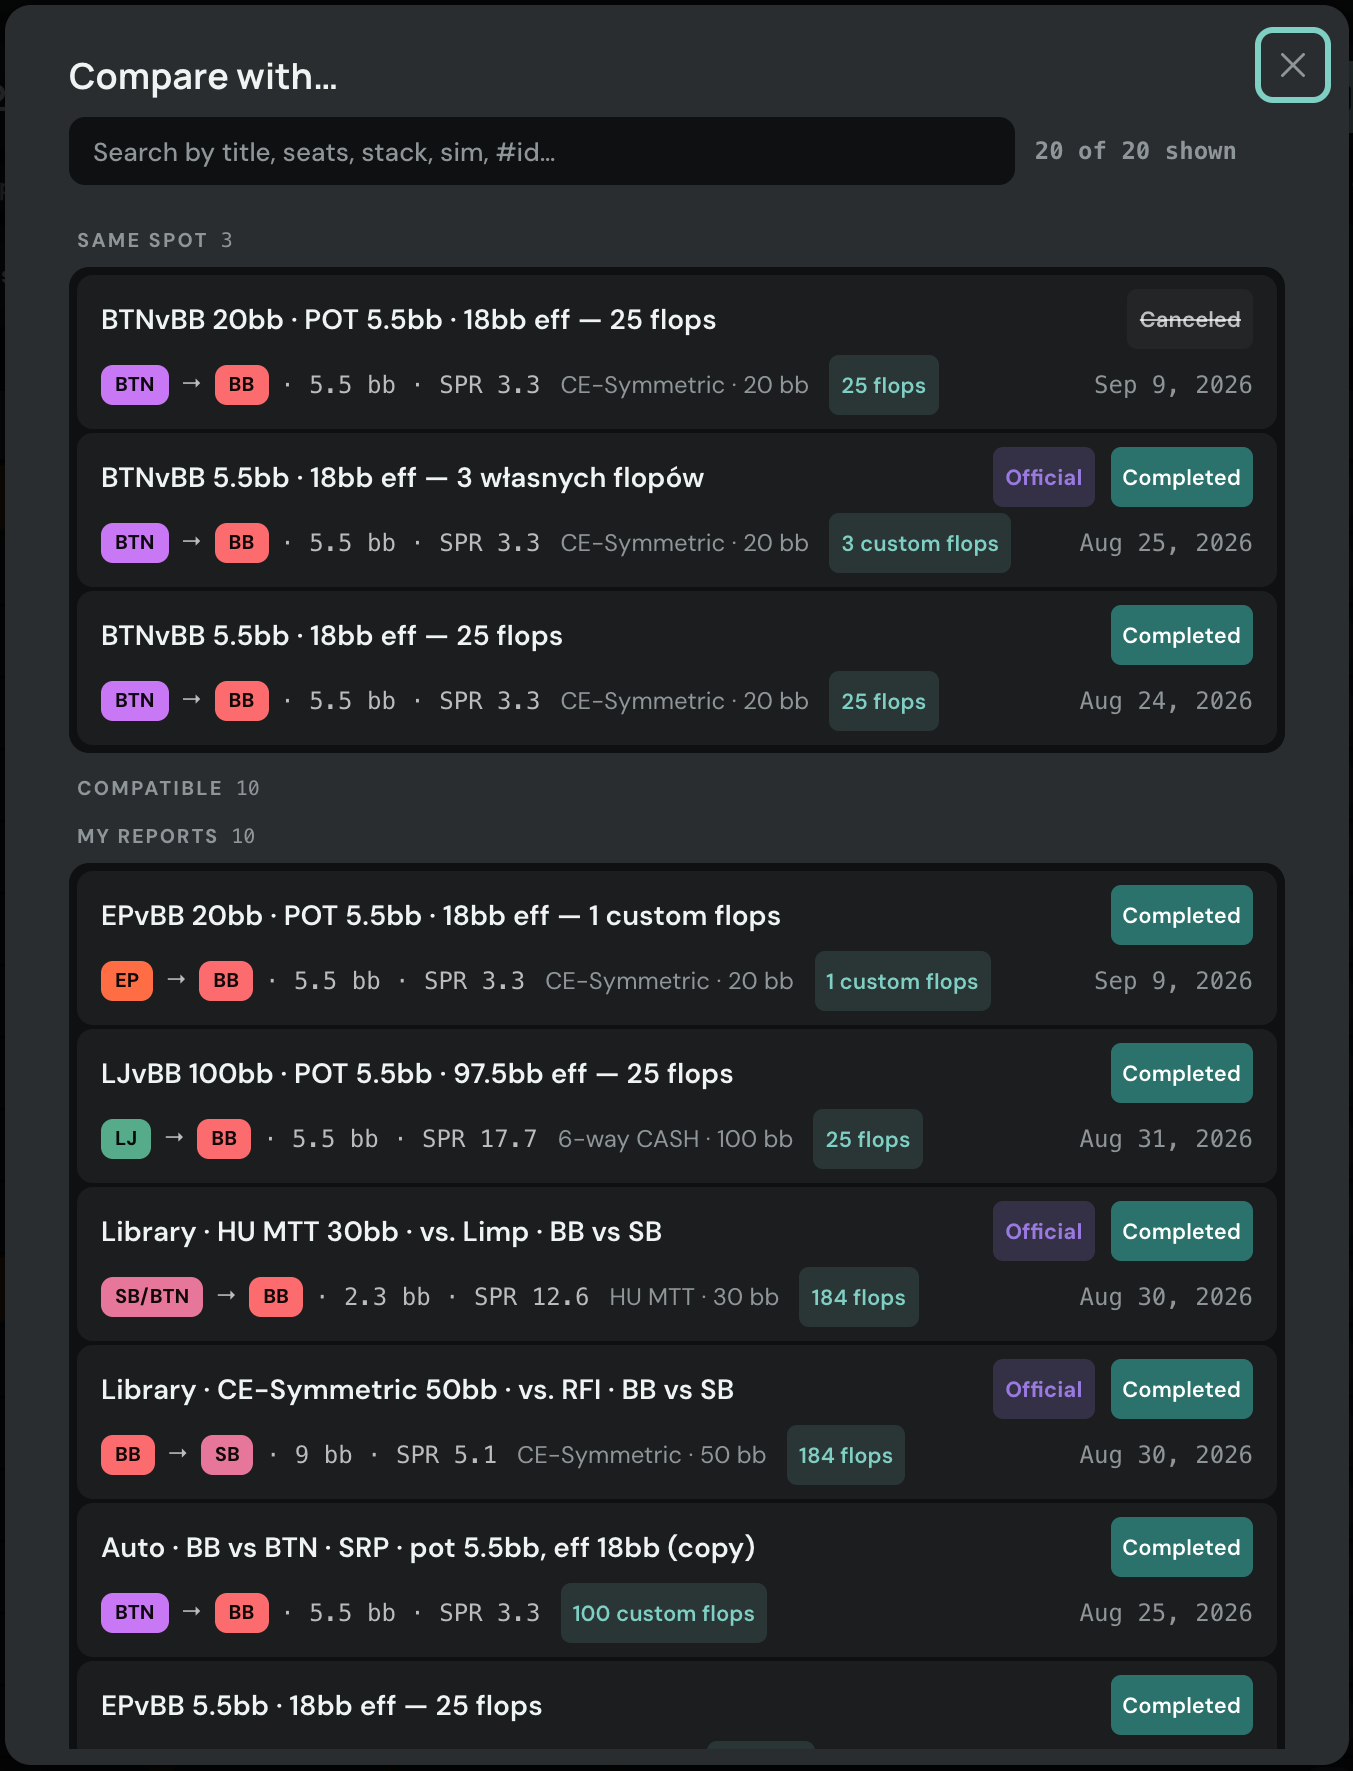
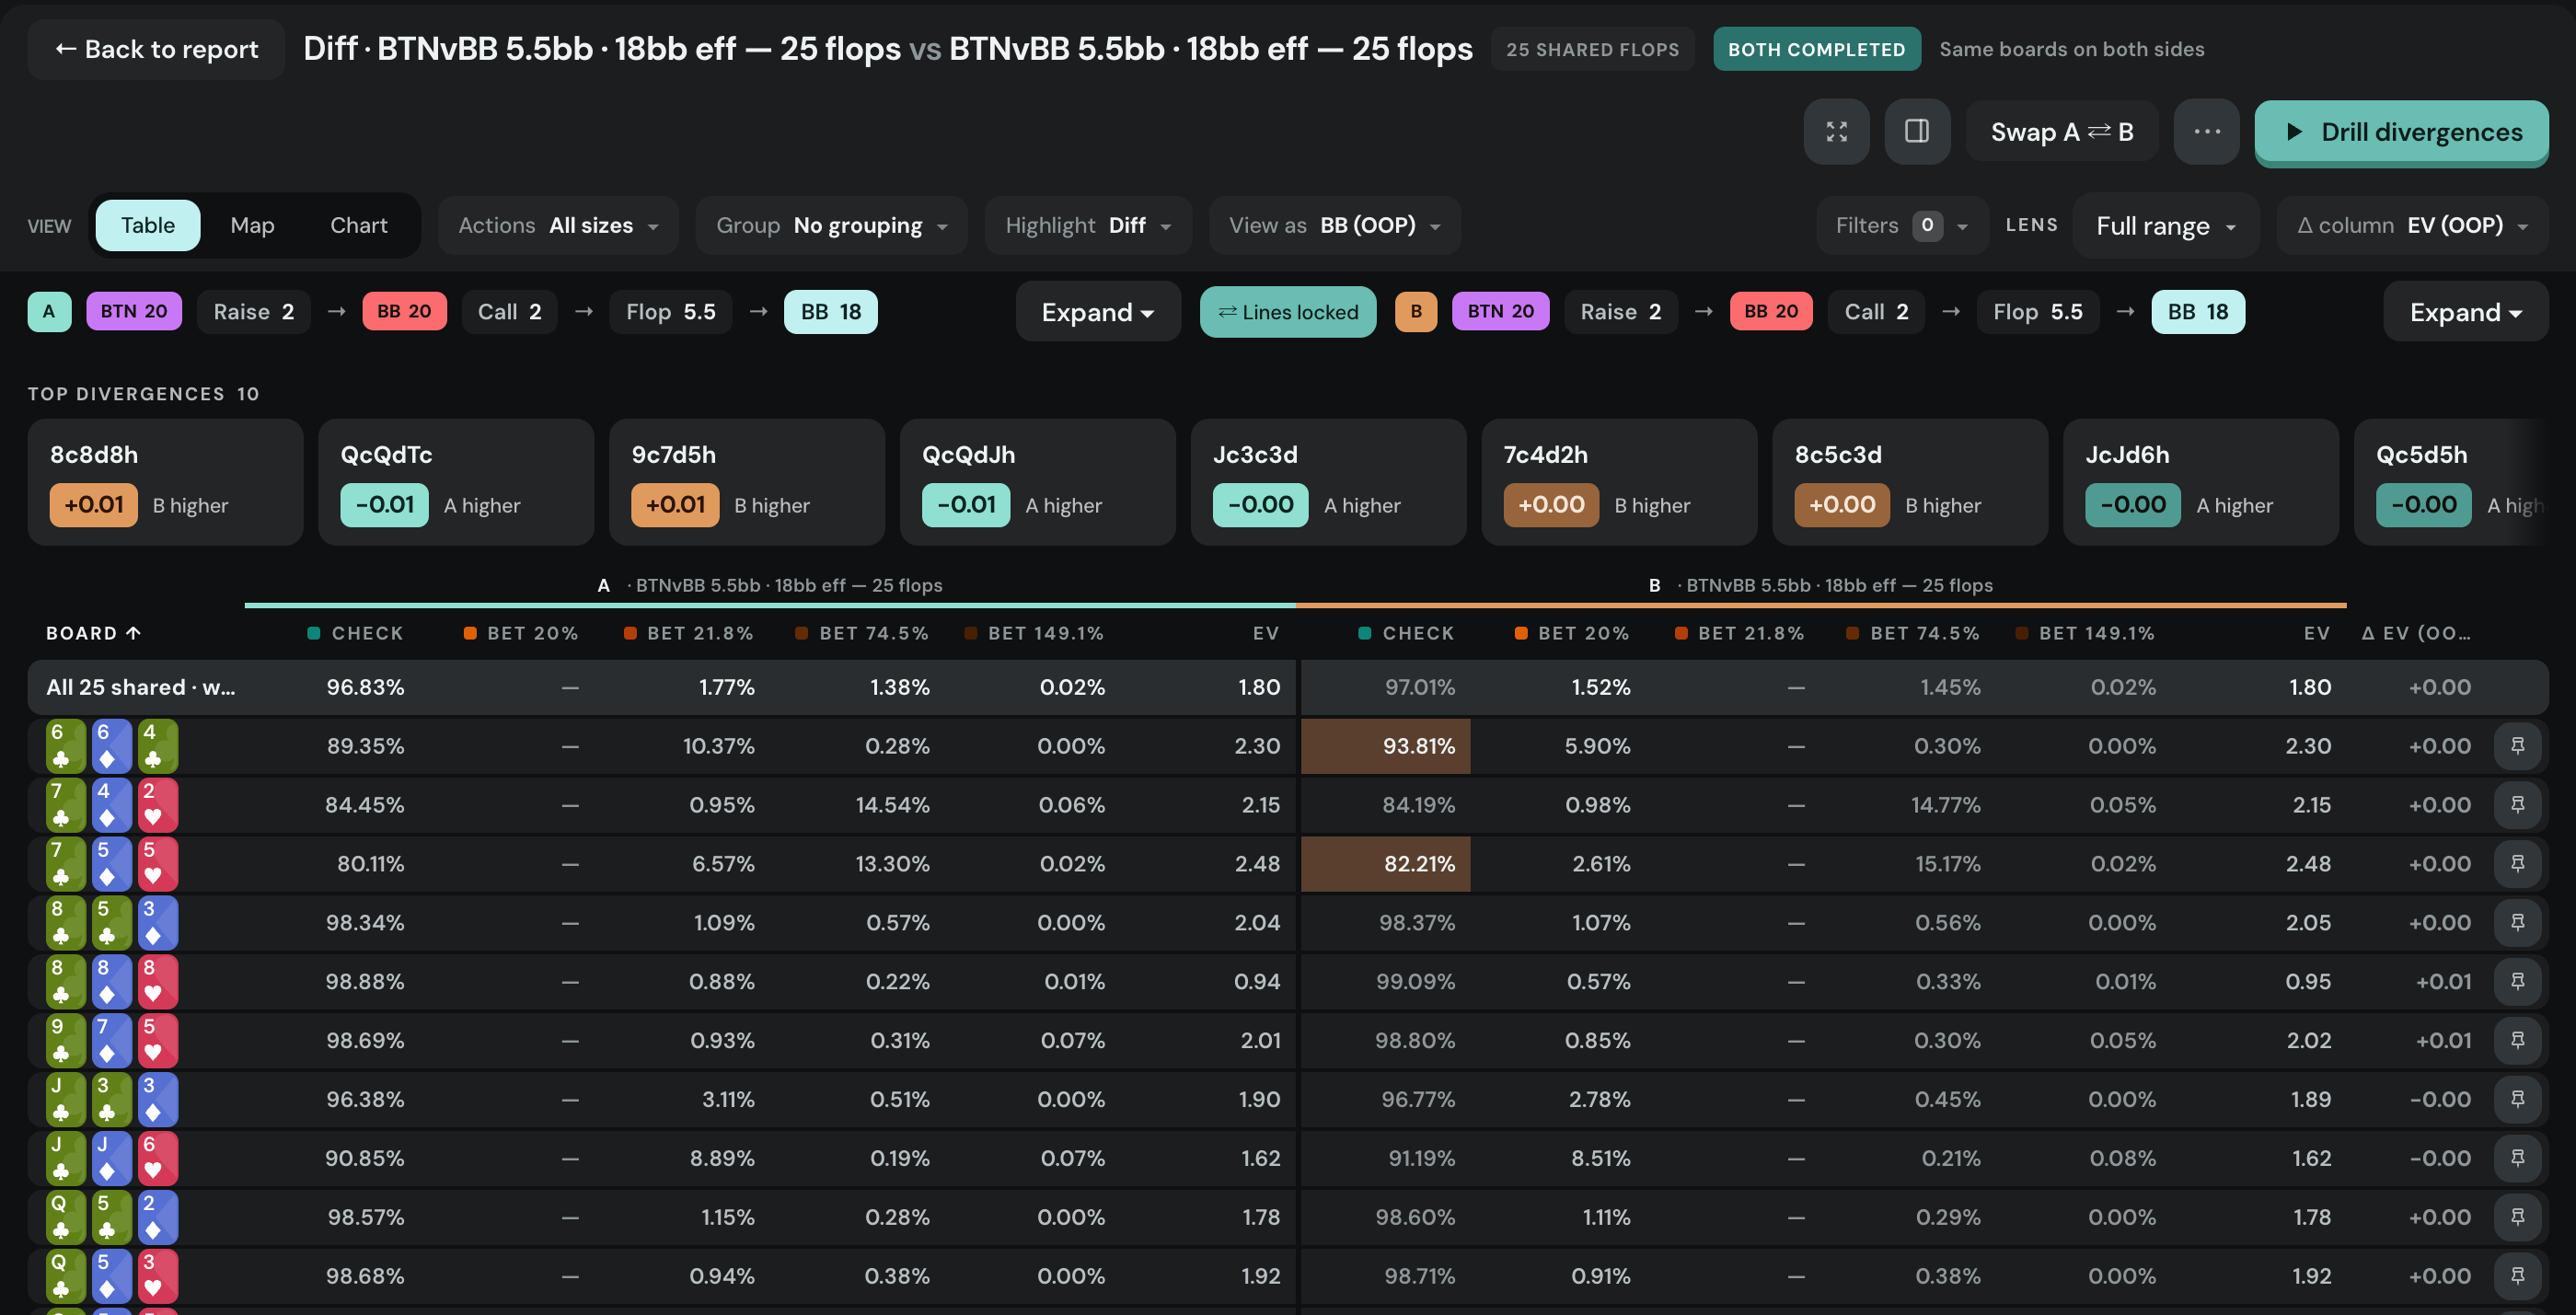
Any two reports on the same street can be diffed board by board. The picker sorts your reports and the community’s into same spot and compatible.
From reading to playing
Every report has a Drill button. With the monotone filter on it reads Drill 11 scenarios: those eleven flops dealt in Practice at this node, fresh hand every time, every decision graded – see the Practice post.
Read the rule. Find where it breaks. Play the boards where it breaks.
Reports are Premium, one runs at a time, and every board they solve stays in your library.
Go find your rule. Cheers! 🙂
Related posts
More in Update
Poker Academy
Stop guessing preflop.
1,500,000+ GTO preflop solutions. Try them free for 3 days.
Start Free TrialCancel anytime.