
Os seus
Tudo o que você montou, mais as cópias dos relatórios que você duplicou.
Relatórios agregados
Veja numa tabela só como um spot se joga em todos os flops. Você monta o spot uma vez. O relatório resolve esse spot num conjunto de flops, pesa cada flop pela frequência com que ele sai e coloca a média em cima, com todos os flops listados embaixo.
As grades deste quadro são arte do filme, e não resultado do solver. O que um relatório mostra está nas capturas de tela abaixo.
Um spot, todos os flops
Formato, posições, pote, stacks, ranges e tamanhos de aposta ficam fixos. Você escolhe quantos flops o relatório cobre e vê quanto isso custa antes de qualquer coisa entrar na fila.
Escolha um escopo e o builder conta os boards, quantos já estão resolvidos na sua biblioteca e quantos faltam. Uma solução só é reaproveitada quando é exatamente o mesmo jogo: mesmo board, mesmos tamanhos, mesmo SPR e mesmos ranges.
Os quatro escopos fixos são aninhados e escolhidos por agrupamento de texturas. Isso é uma heurística para cobrir o espaço de flops, e não uma amostra otimizada por EV, e o próprio app avisa. O Custom aceita a sua própria lista.
A duração na captura de tela vem de uma única prévia, feita num único dia. O builder a estima a partir das soluções recentes, então o número muda conforme a fila.
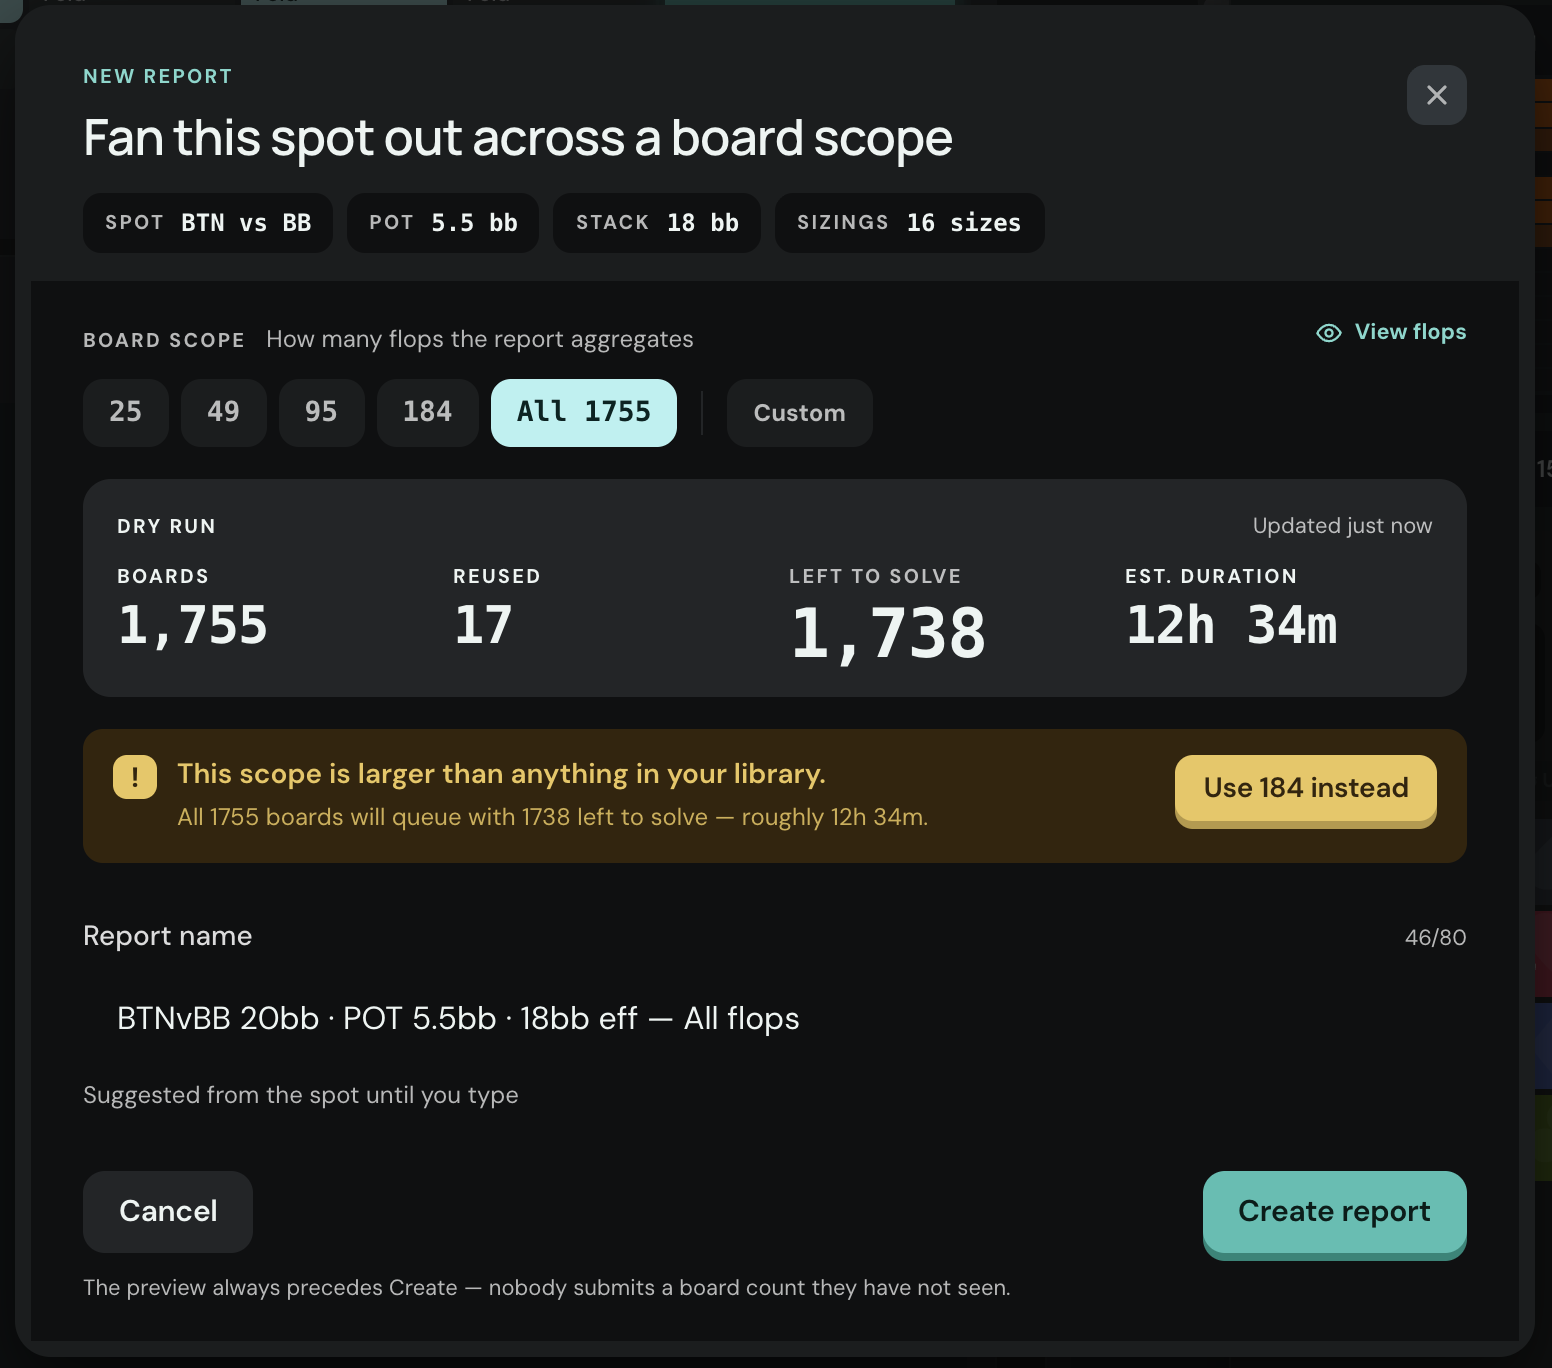 Escopo de boards e a prévia: boards, reaproveitados, faltando resolver
A tabela do relatório
A linha ponderada é a estratégia do spot em geral. Cada linha abaixo dela é um flop, então os boards que quebram a regra ficam logo abaixo da regra que eles quebram.
SB vs BB · 50 bb · 9-max · ante de 1 bb · 184 flops · SB age primeiro no flop
Arredondado para uma casa decimal. O peso é quantos dos 22.100 flops possíveis cada board representa.
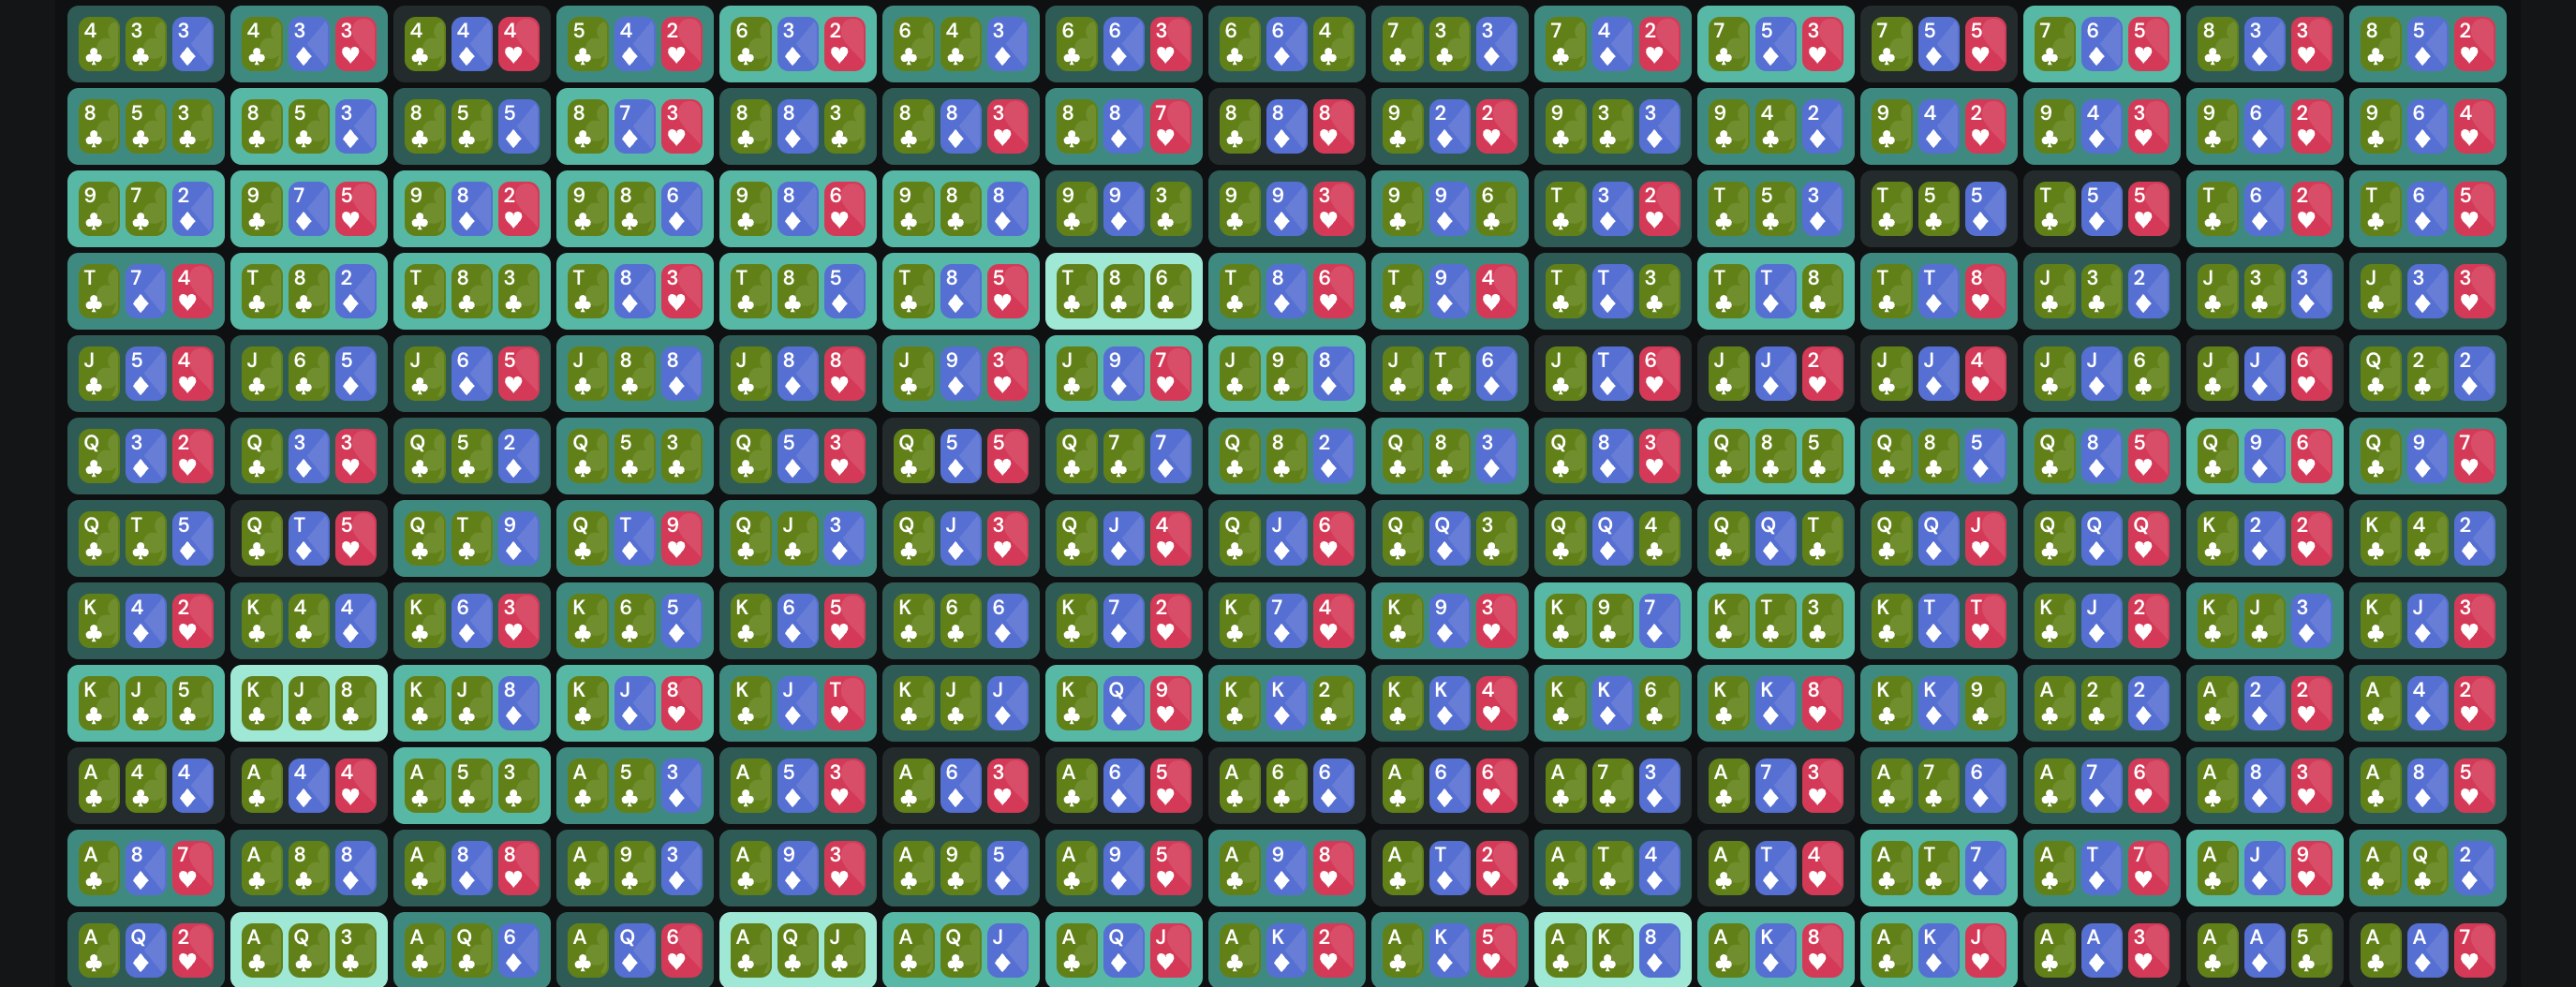 Os mesmos 184 flops em forma de mapa, coloridos pela frequência de check. Quadrados mais claros checam mais.
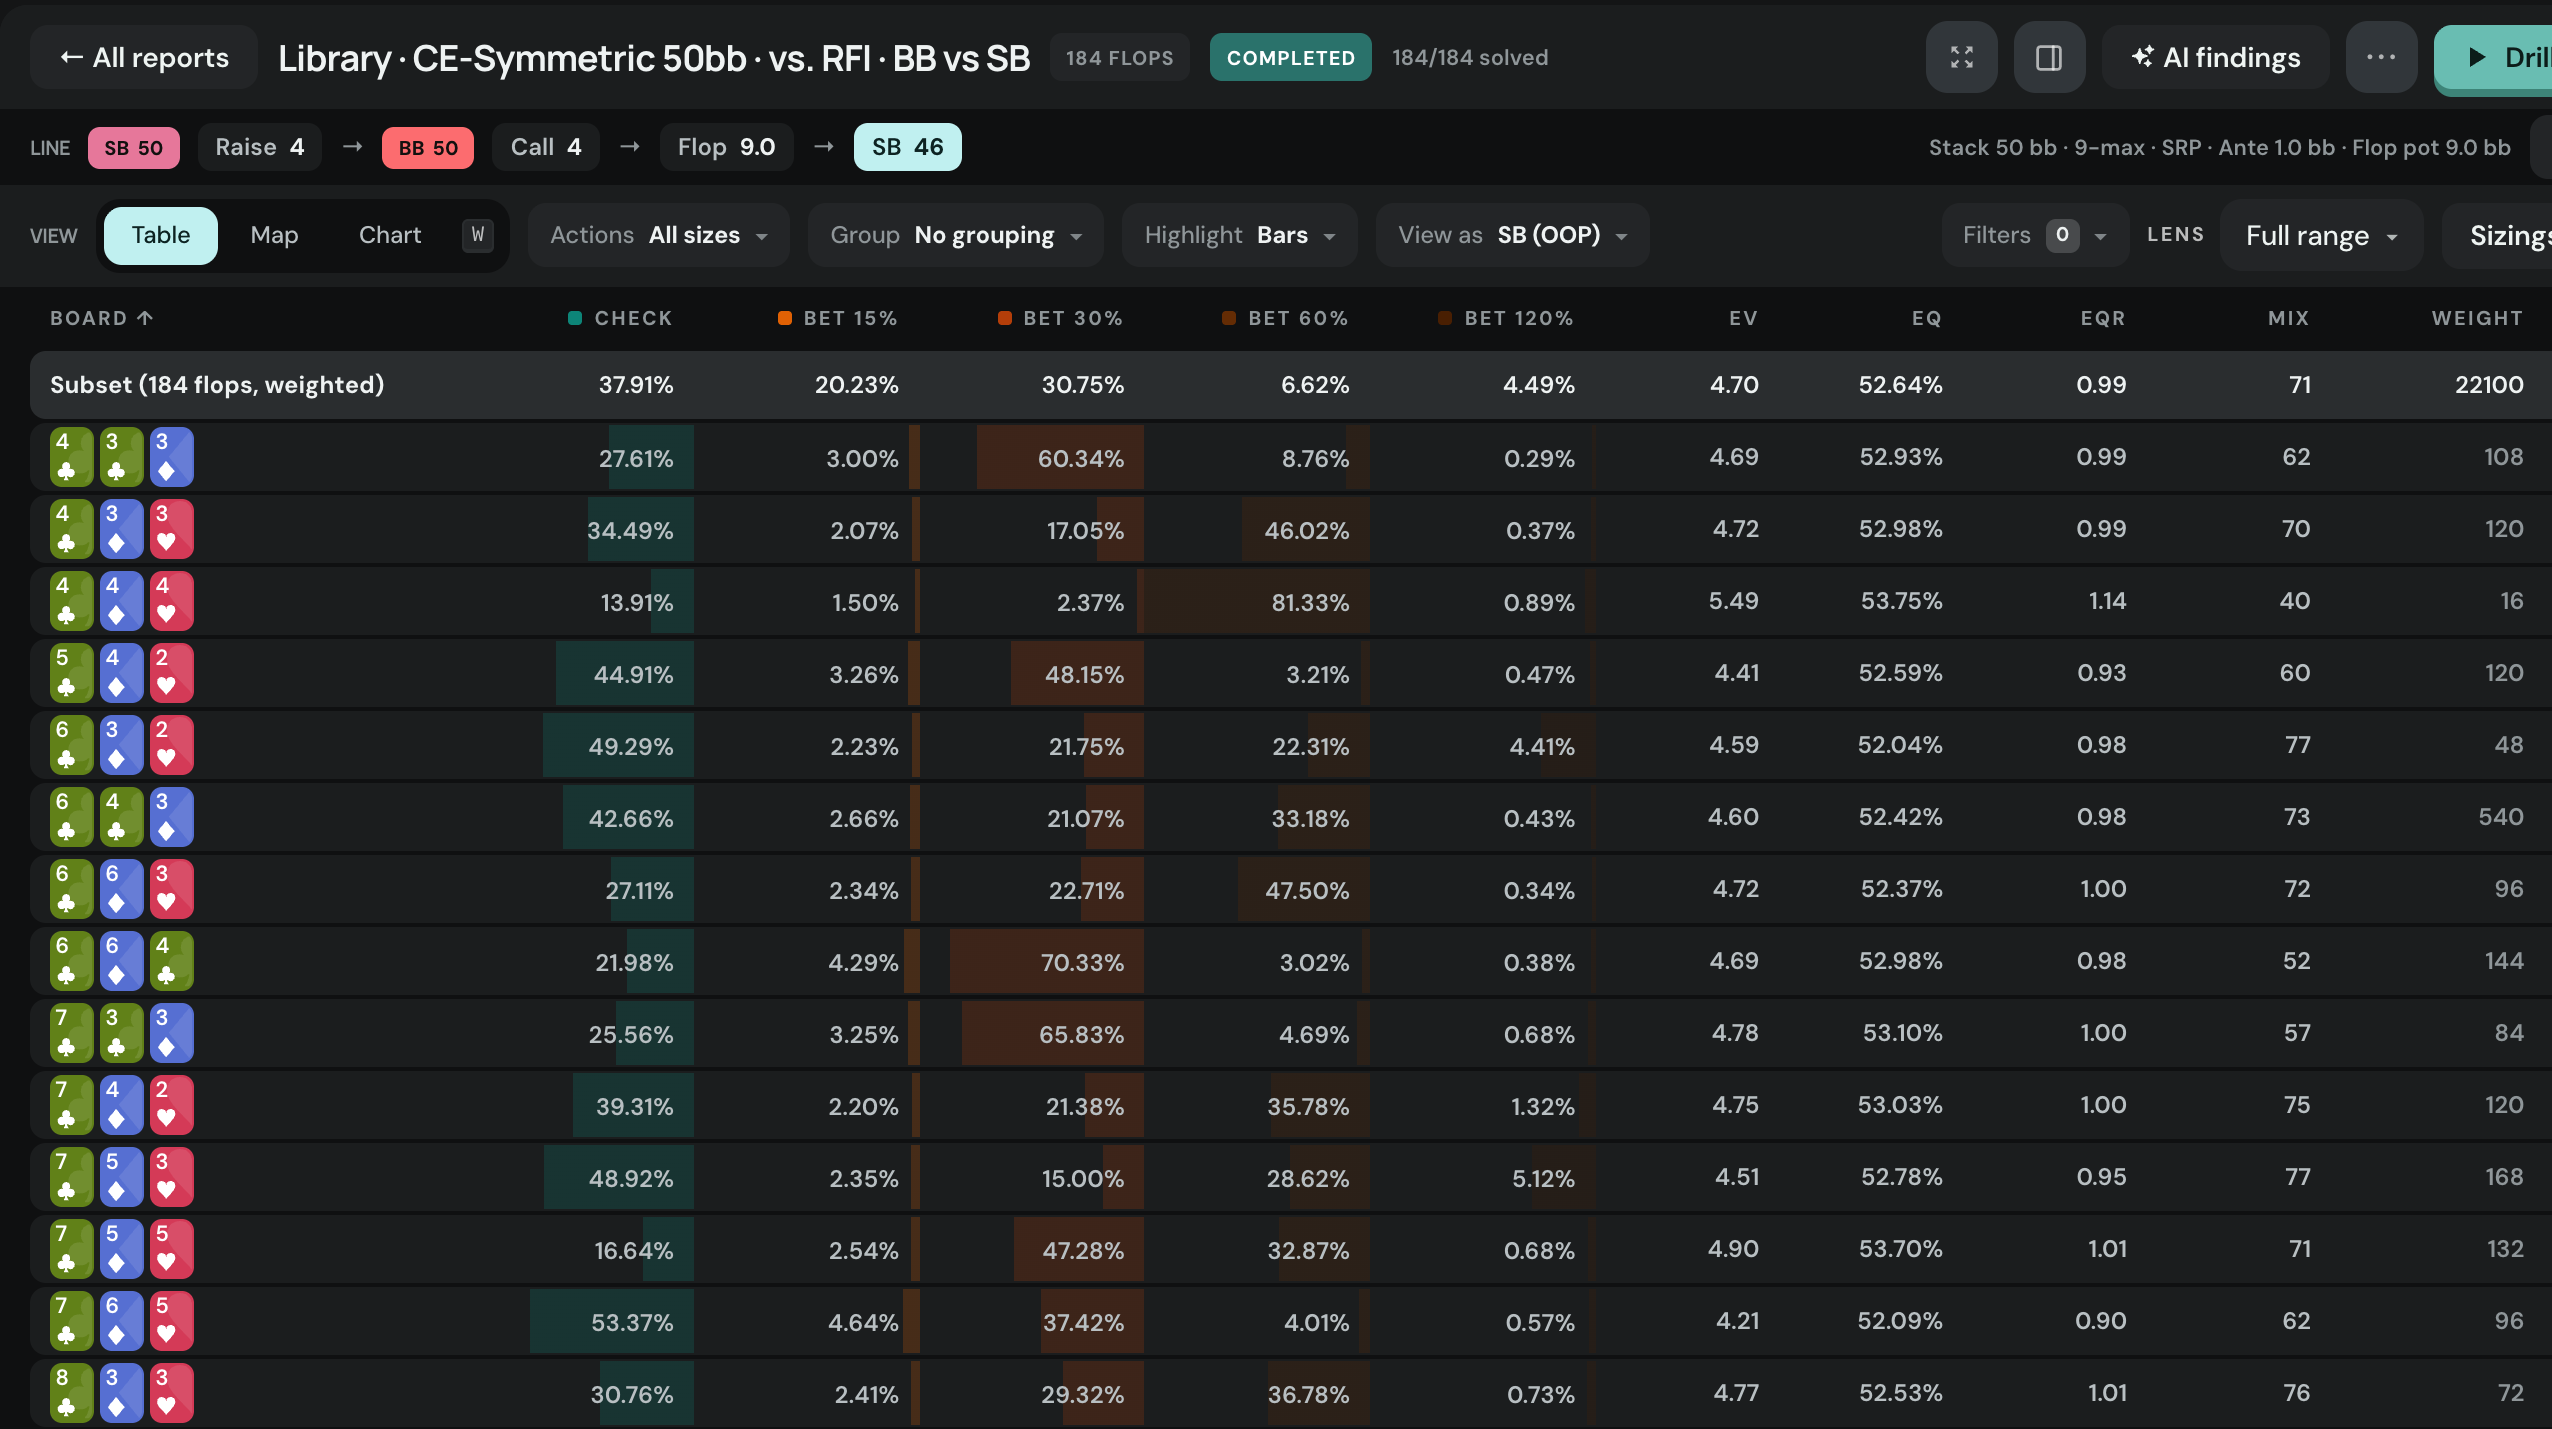 A tabela inteira: frequências das ações, EV, EQ, EQR, mix e peso por flop. Clique numa coluna para ordenar.
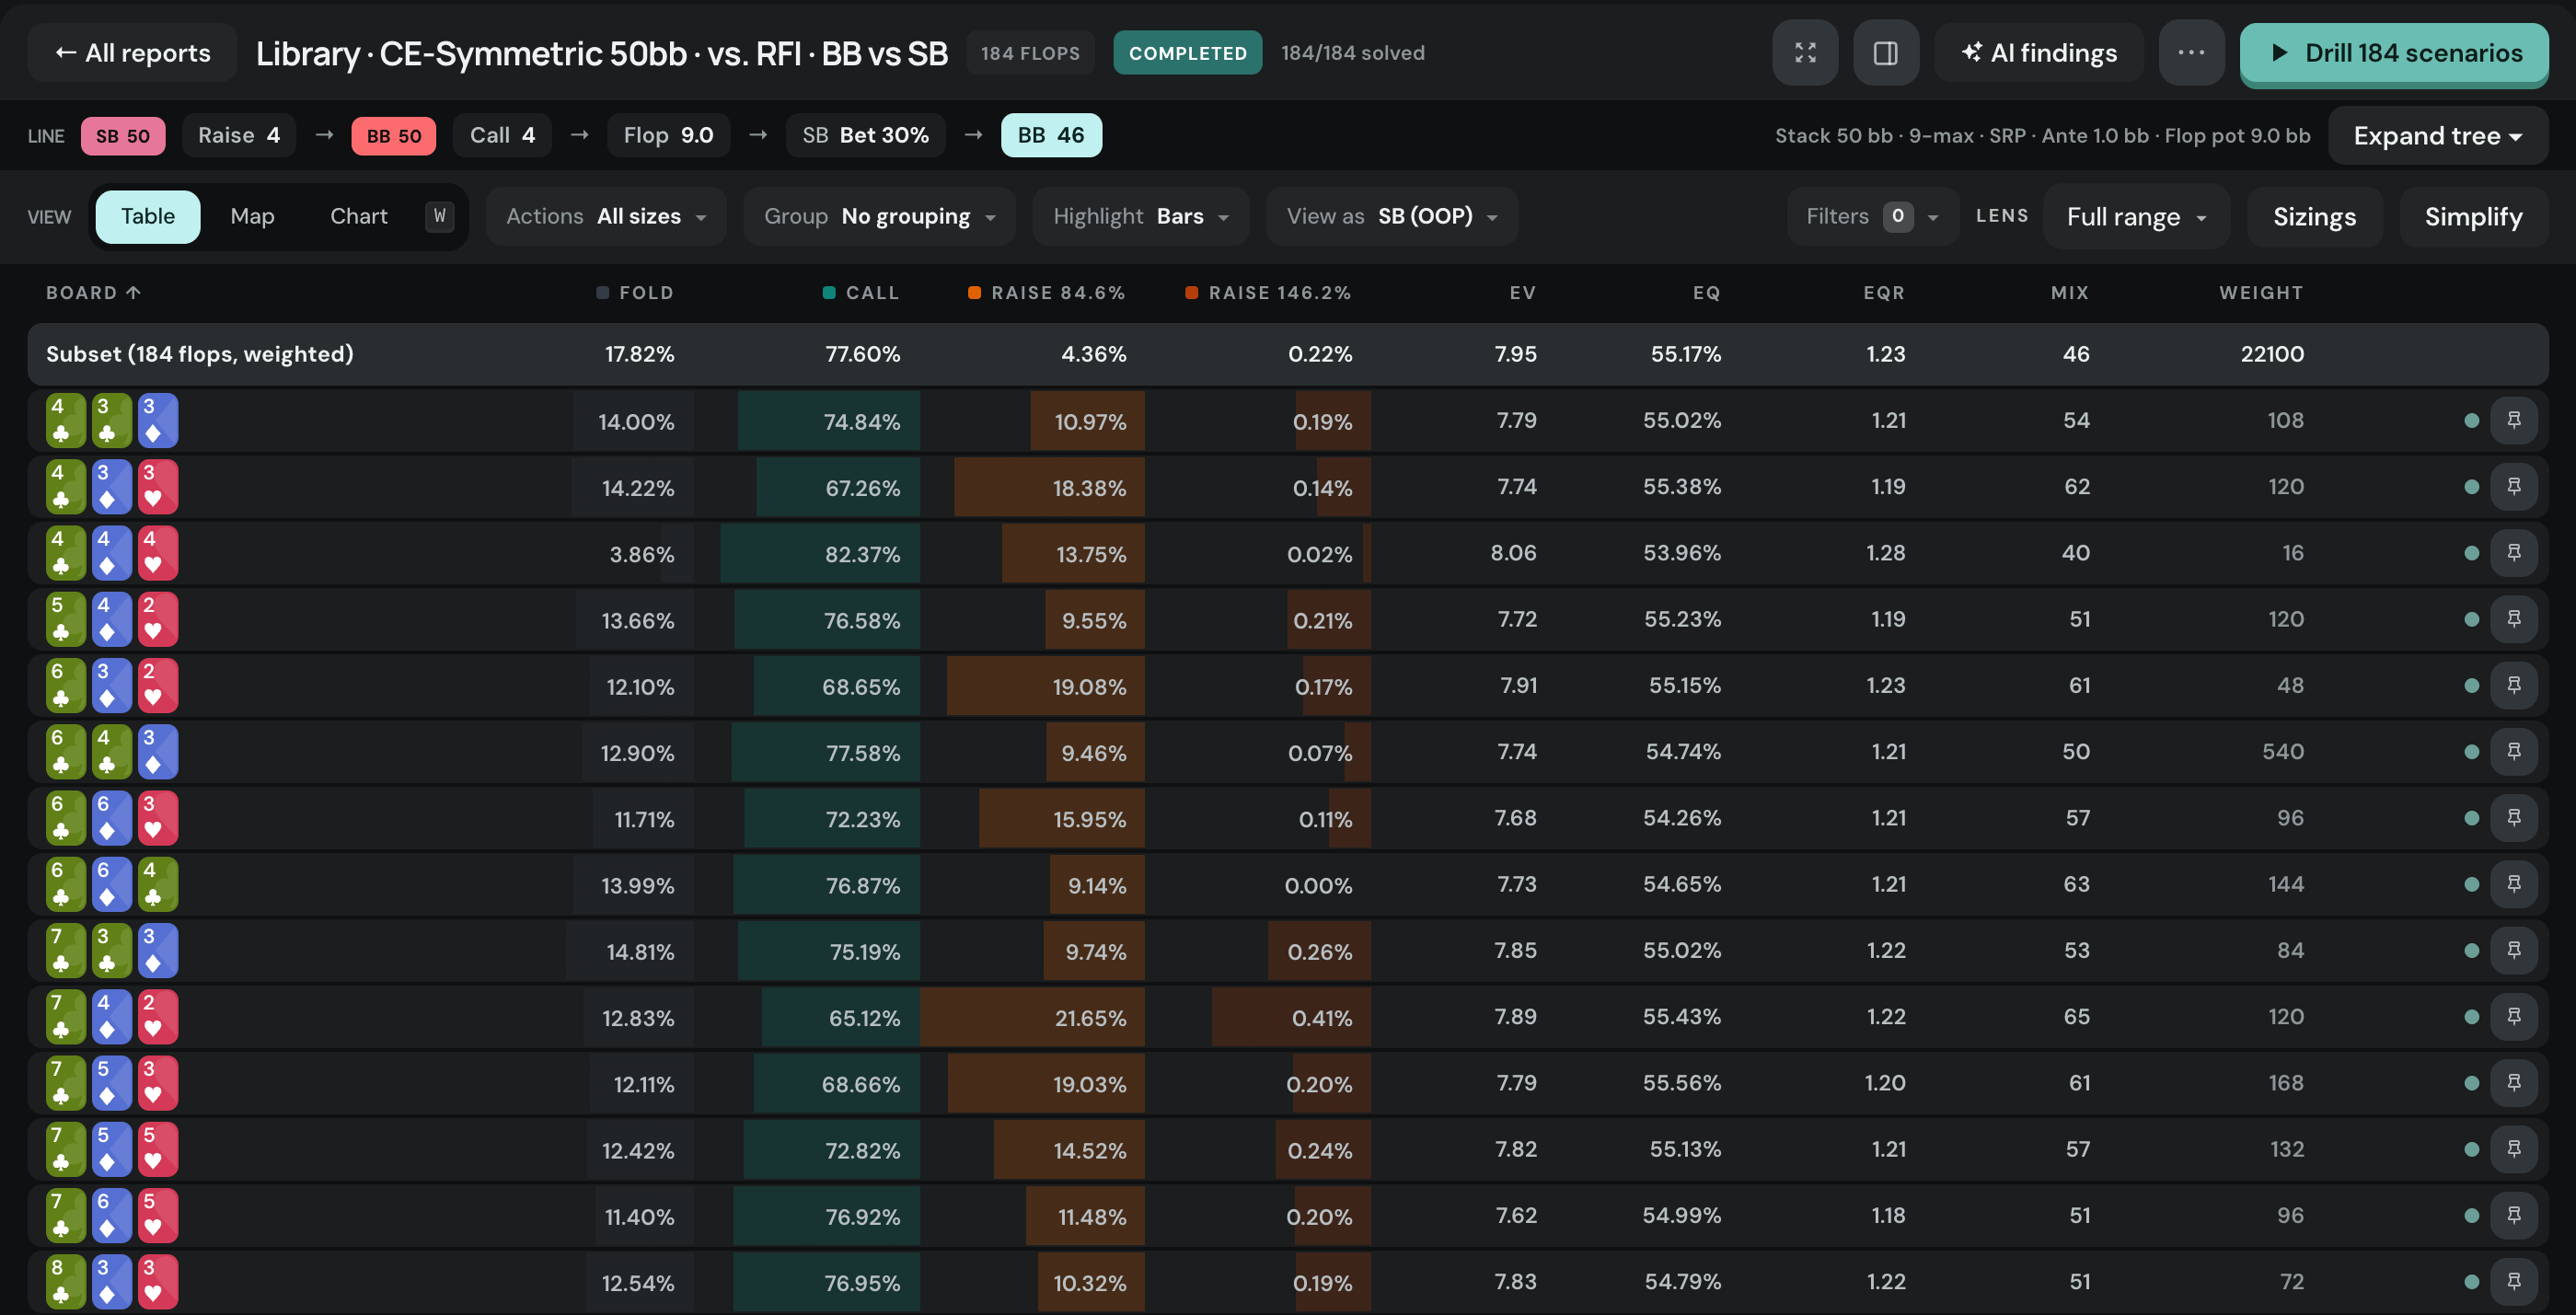 Um nó adiante: o BB diante da aposta, nos 184 boards de uma vez
Percorra a árvore
Clique numa ação da linha e o relatório inteiro é reagregado um nó adiante. A aposta no flop vira a pergunta: como o BB se defende dela em todos os boards do escopo?
Descubra onde a regra quebra
Cada tag de textura mostra uma contagem, então você sabe quantos boards um filtro deixa antes de clicar nele. As linhas filtradas podem ser escondidas ou esmaecidas, e uma linha de comparação coloca a média filtrada ao lado da média completa.
Cinco famílias. Cada contagem é quantos dos 184 boards deste relatório têm a tag.
Naipes
Pareamento
Conectividade
Altura
Carta mais alta
Linhas filtradas
Agrupar linhas por um eixo
Só monotone: 11 boards, com a diferença em relação ao conjunto completo ao lado de cada coluna.
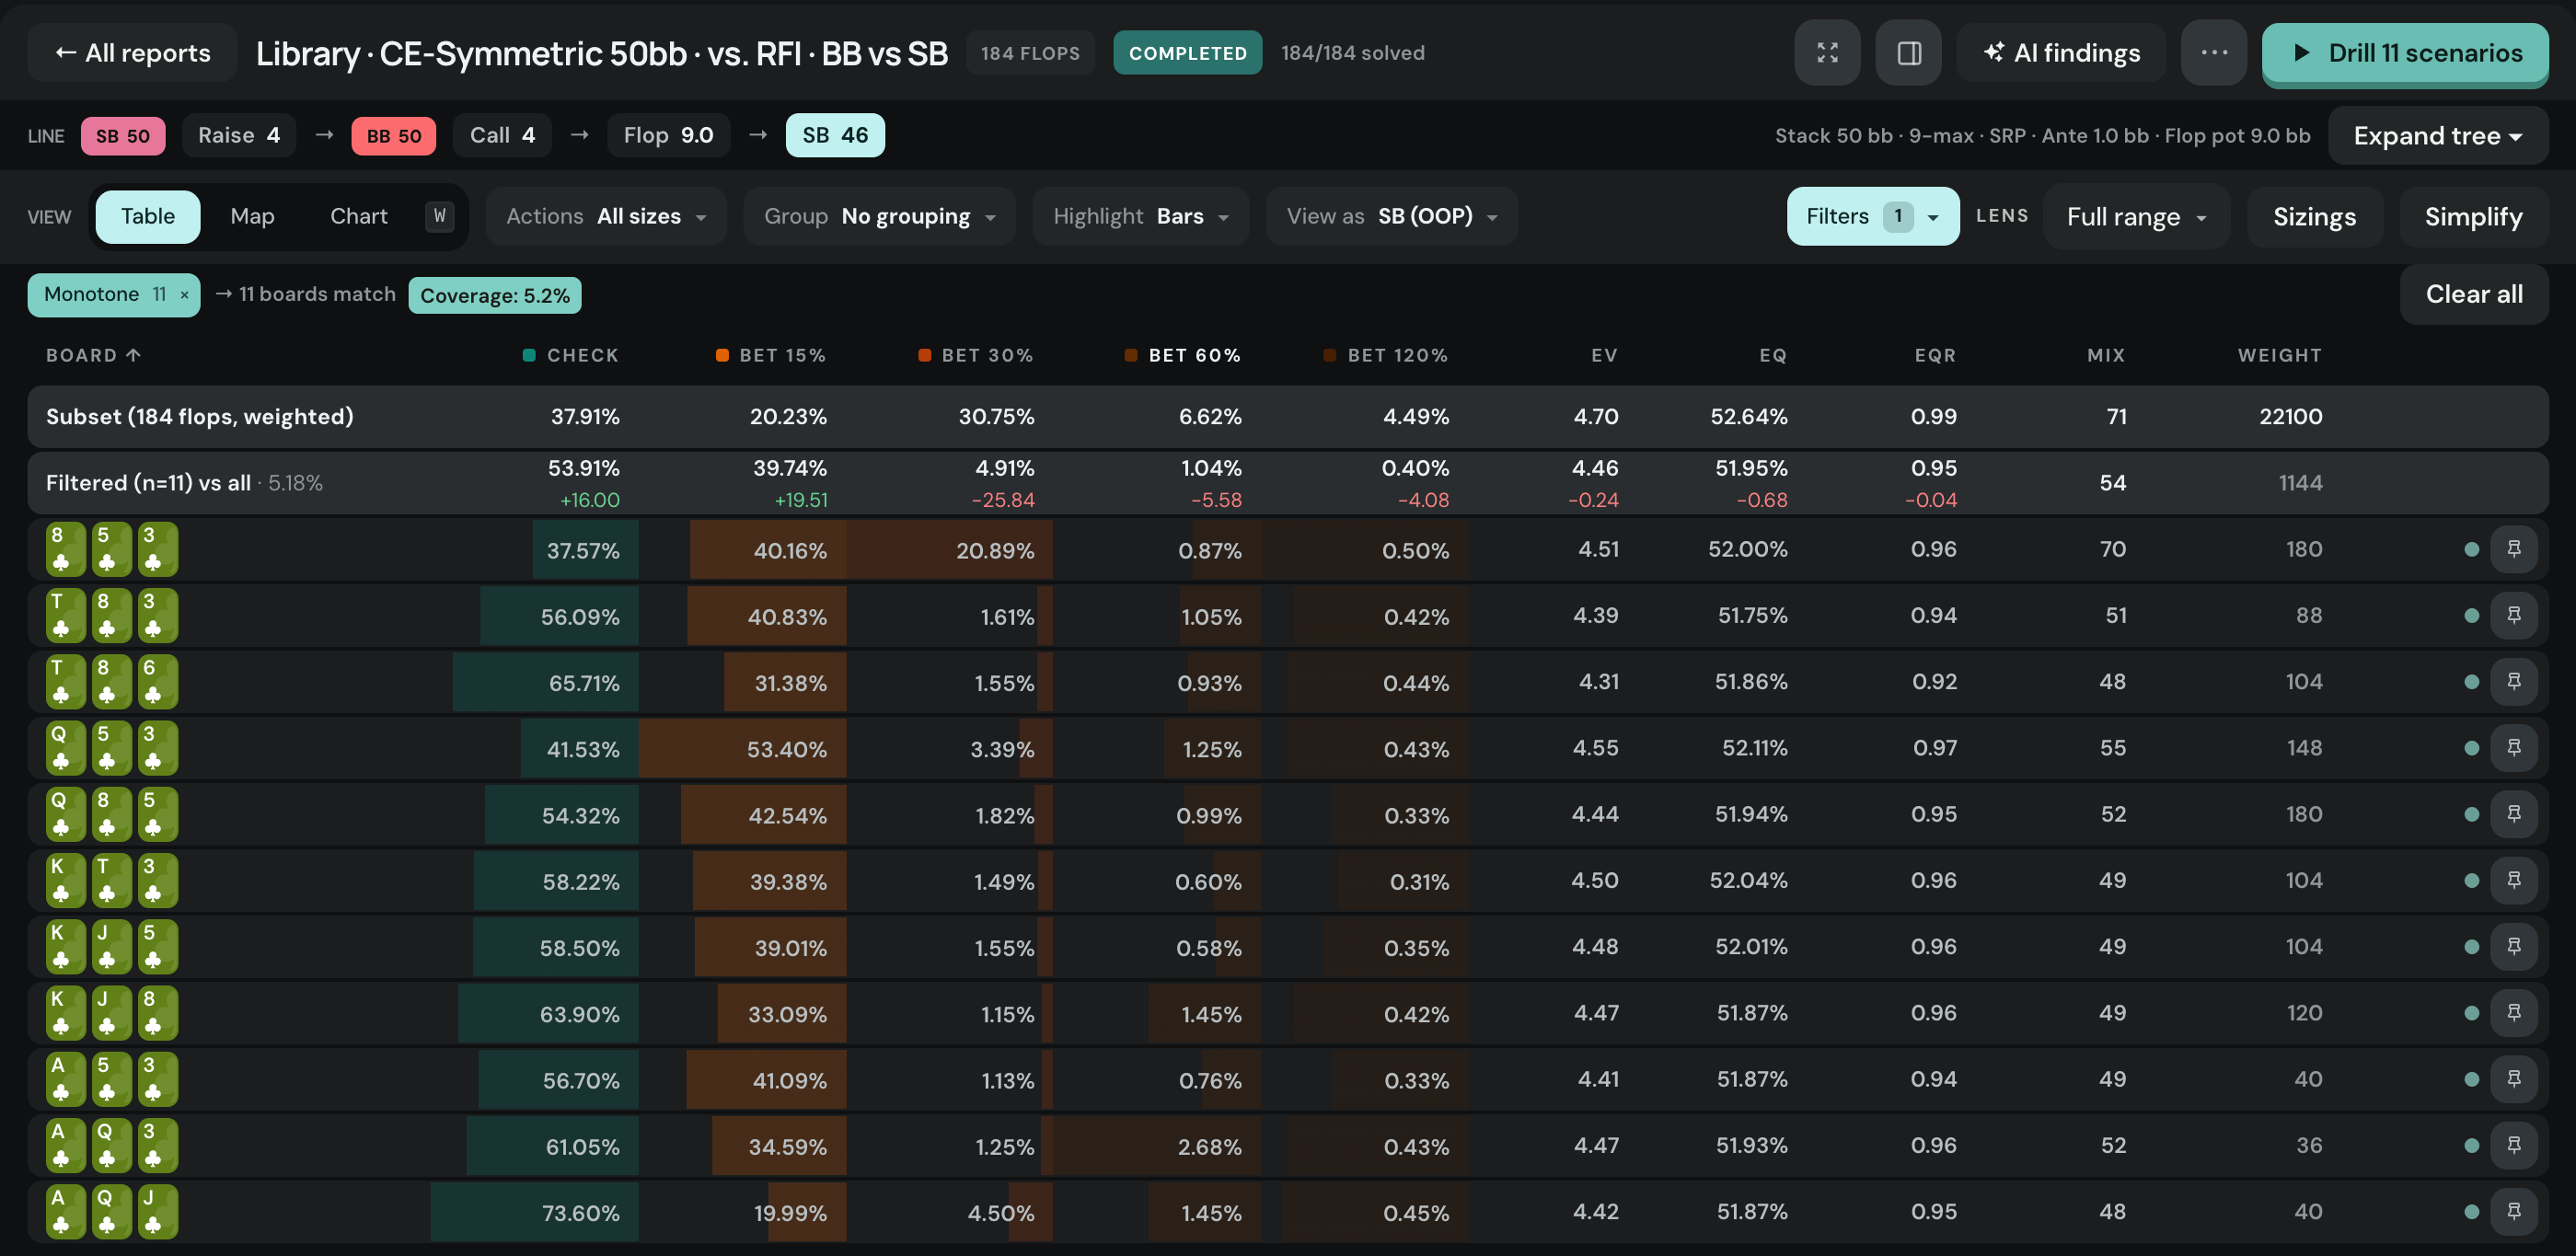 Monotone, 11 de 184 boards
Uma barra empilhada por board e uma linha tracejada para a média ponderada. A distribuição dos tamanhos de aposta fica logo abaixo.
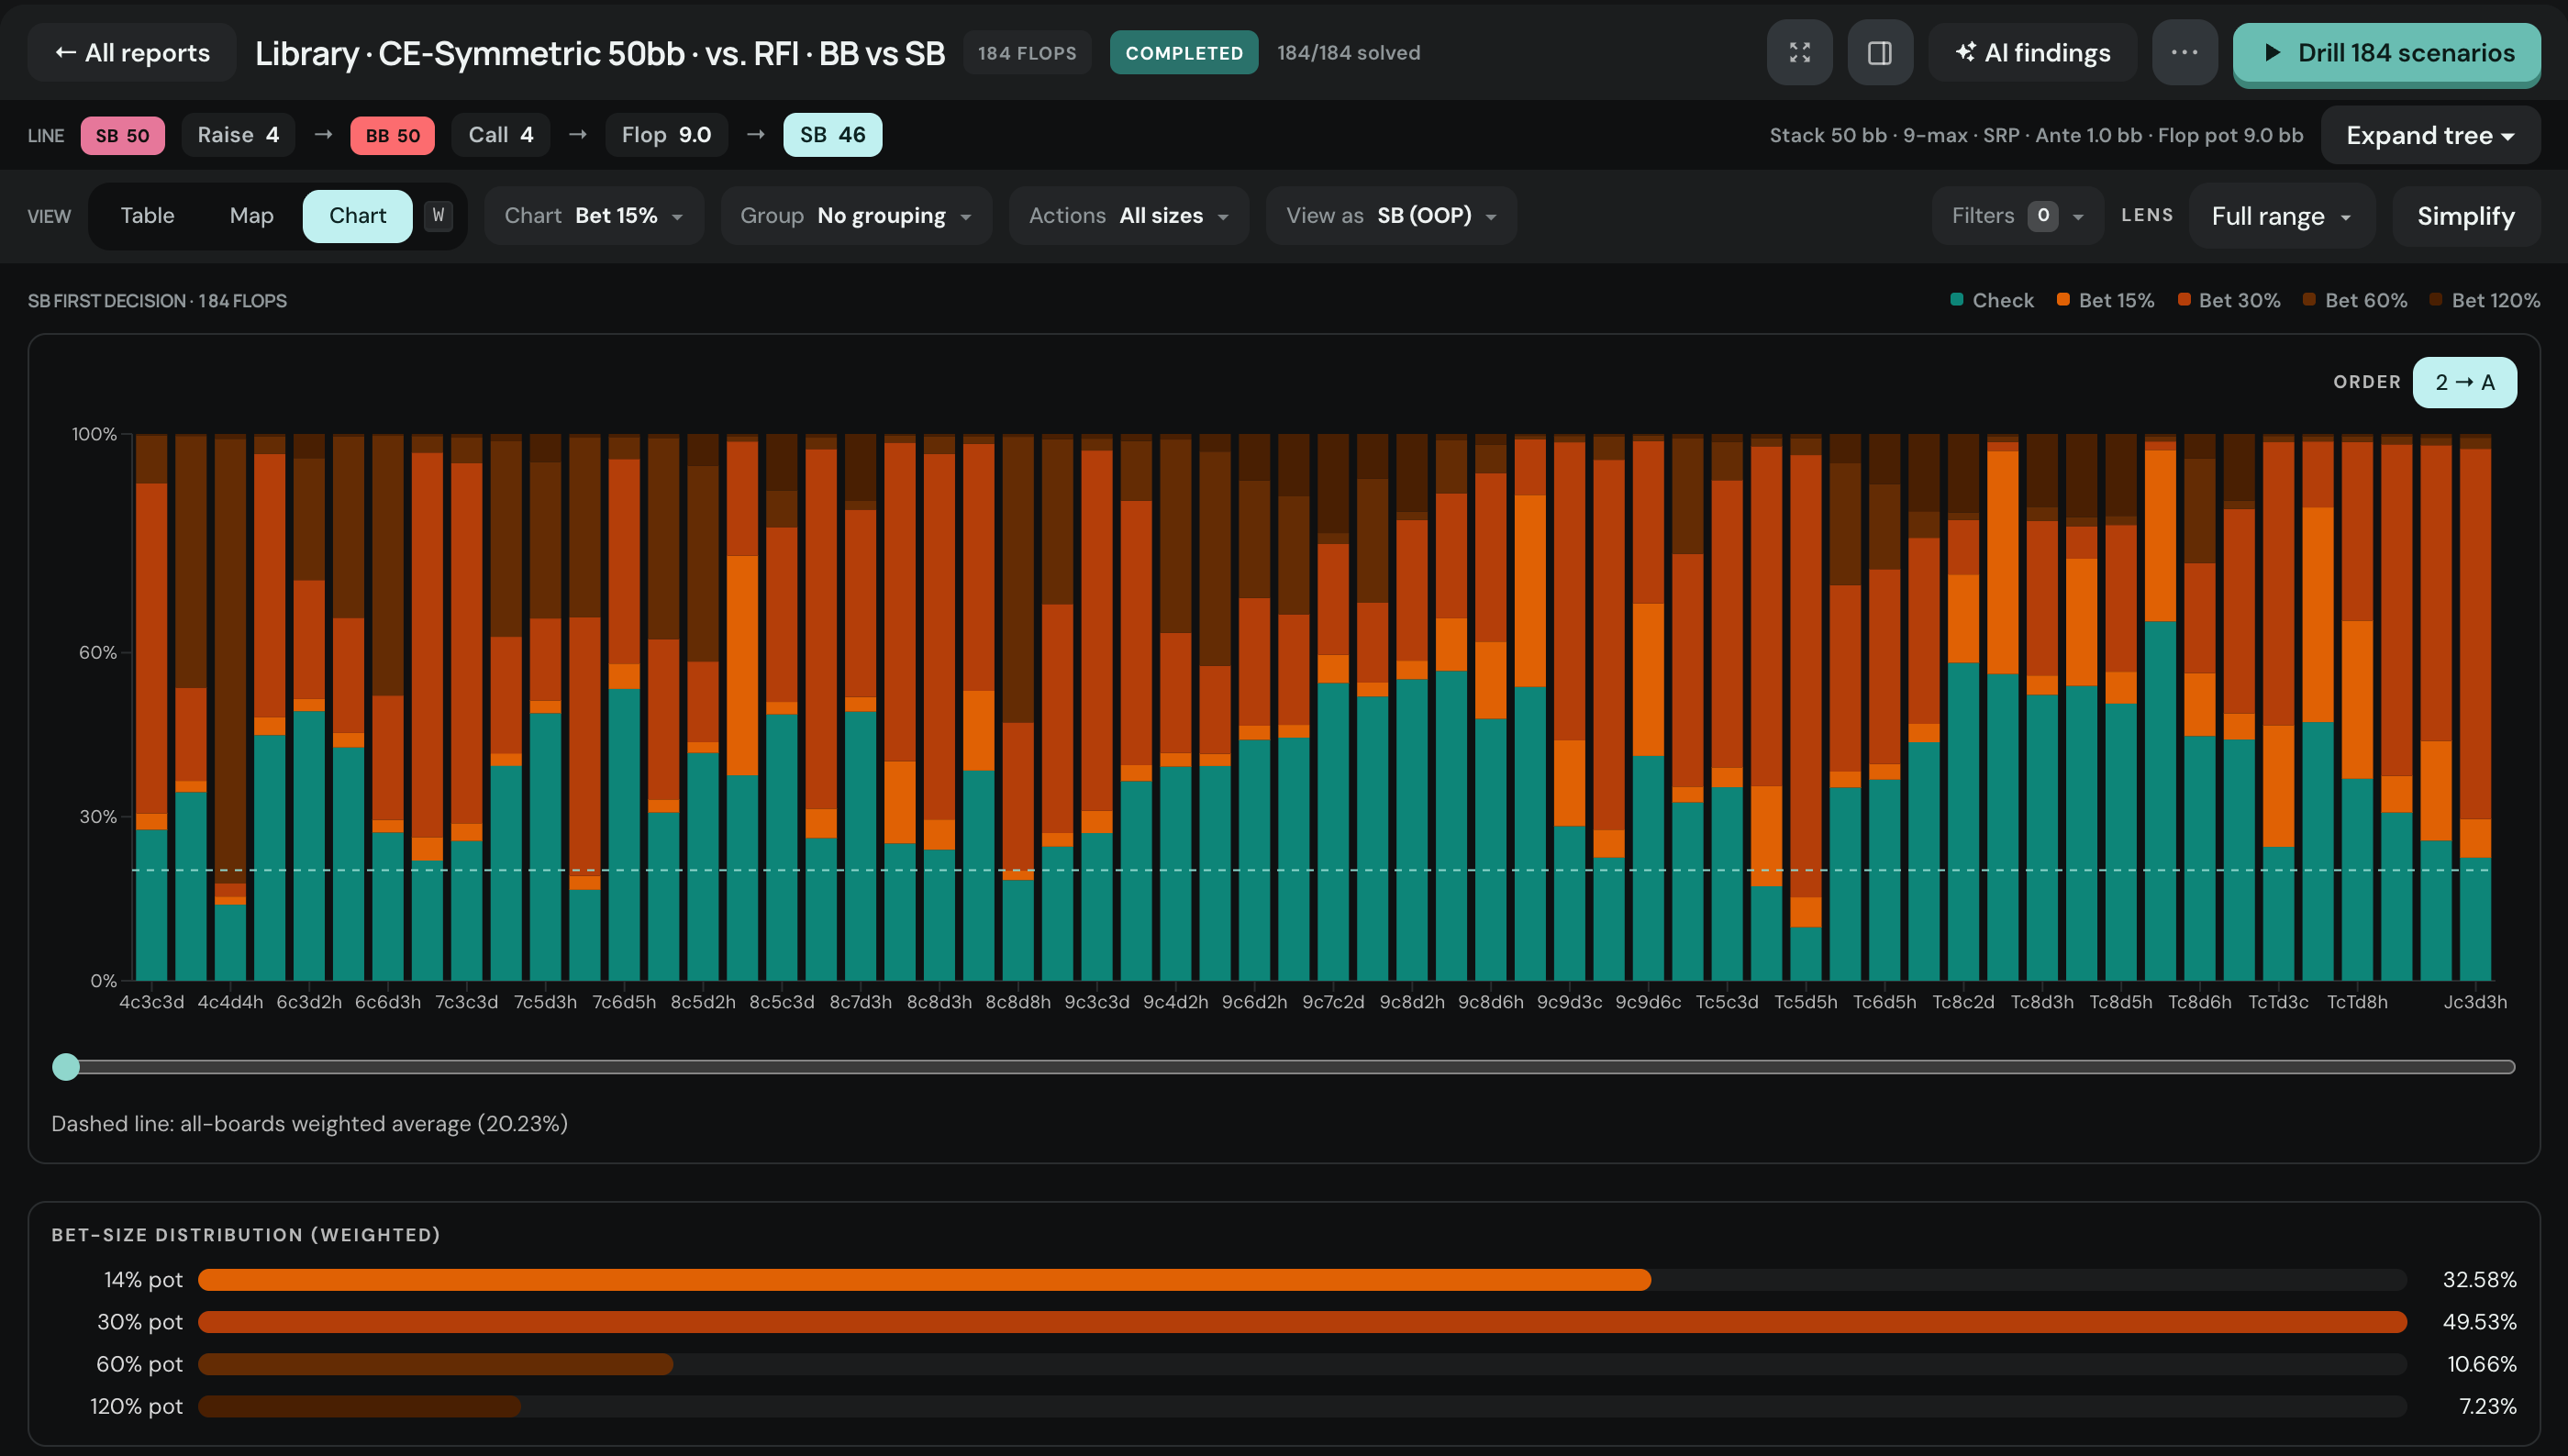 Visualização em gráfico, com a linha da média ponderada
Tudo pela ótica de uma mão
A lente de classe lê cada número por uma única classe de mão: 14 classes de mãos feitas, 6 de draws, 10 detalhadas como TPTK, sets e nut flush, ou um combo exato. Funciona em relatórios de até 200 boards.
Mãos feitas, draws, as classes detalhadas ou um único combo.
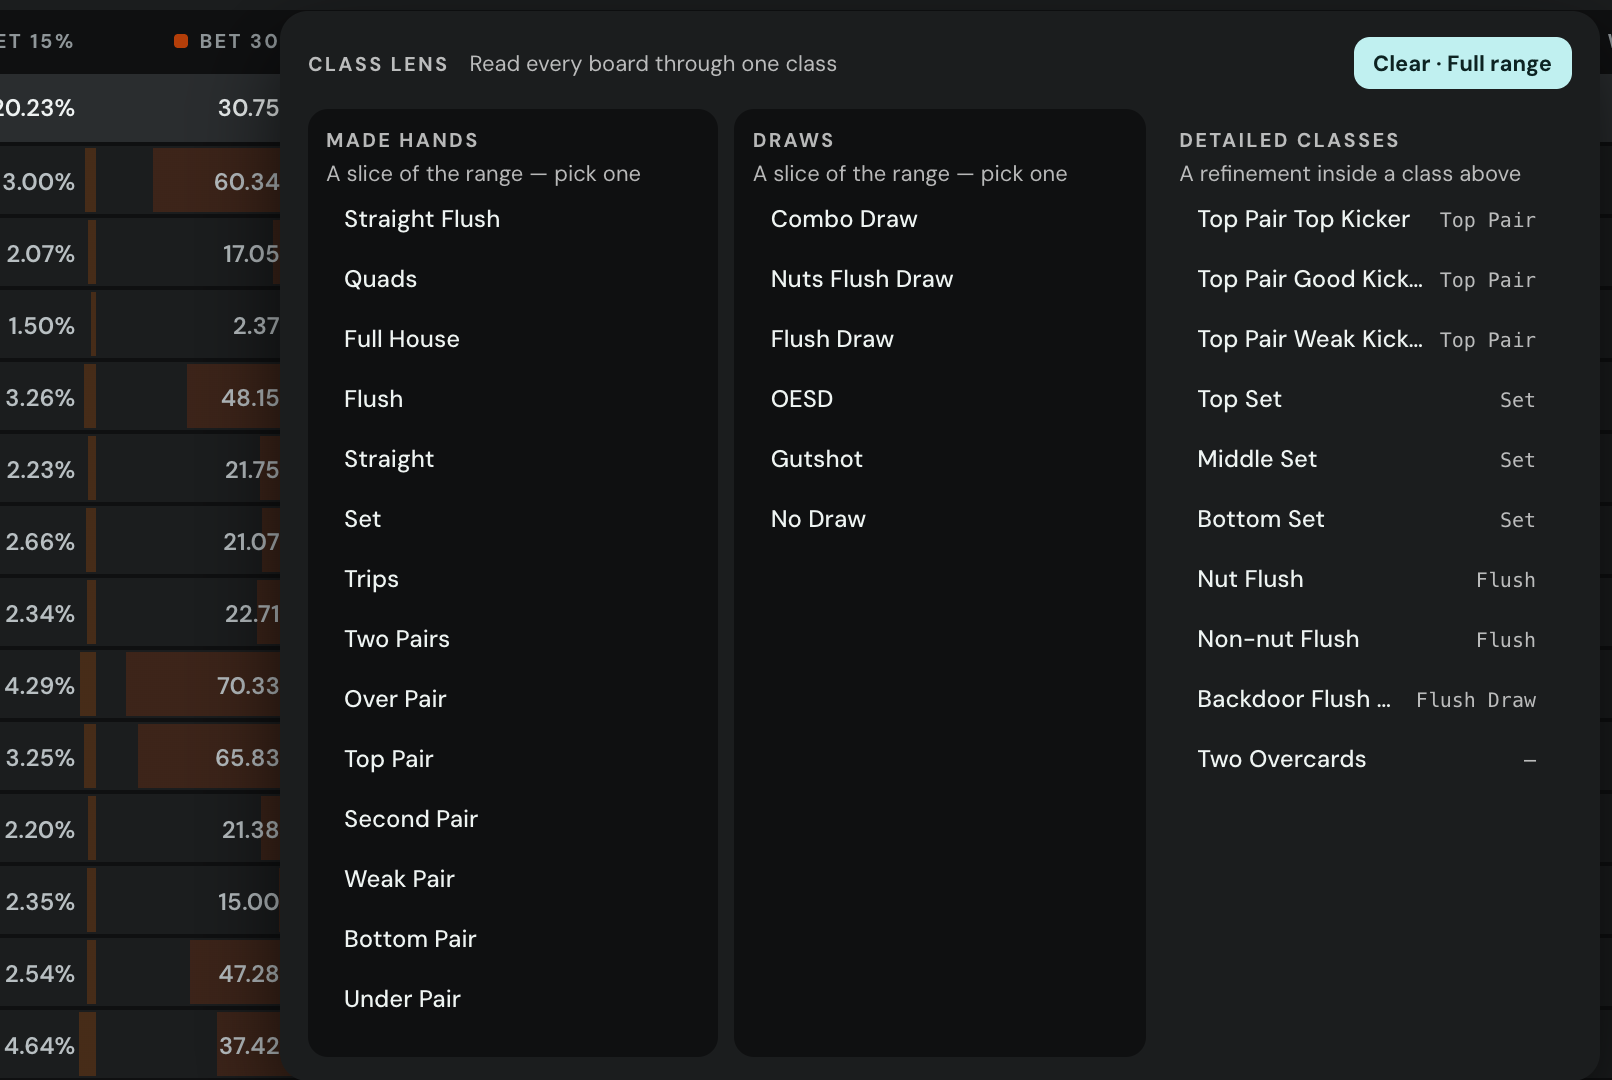 O seletor da lente
Num board em que a classe não pode existir, aparece “sem dados”, nunca 0%. Neste relatório, 150 dos 184 boards têm top pair e 34 aparecem sem dados. A média cobre só os boards em que a pergunta faz sentido.
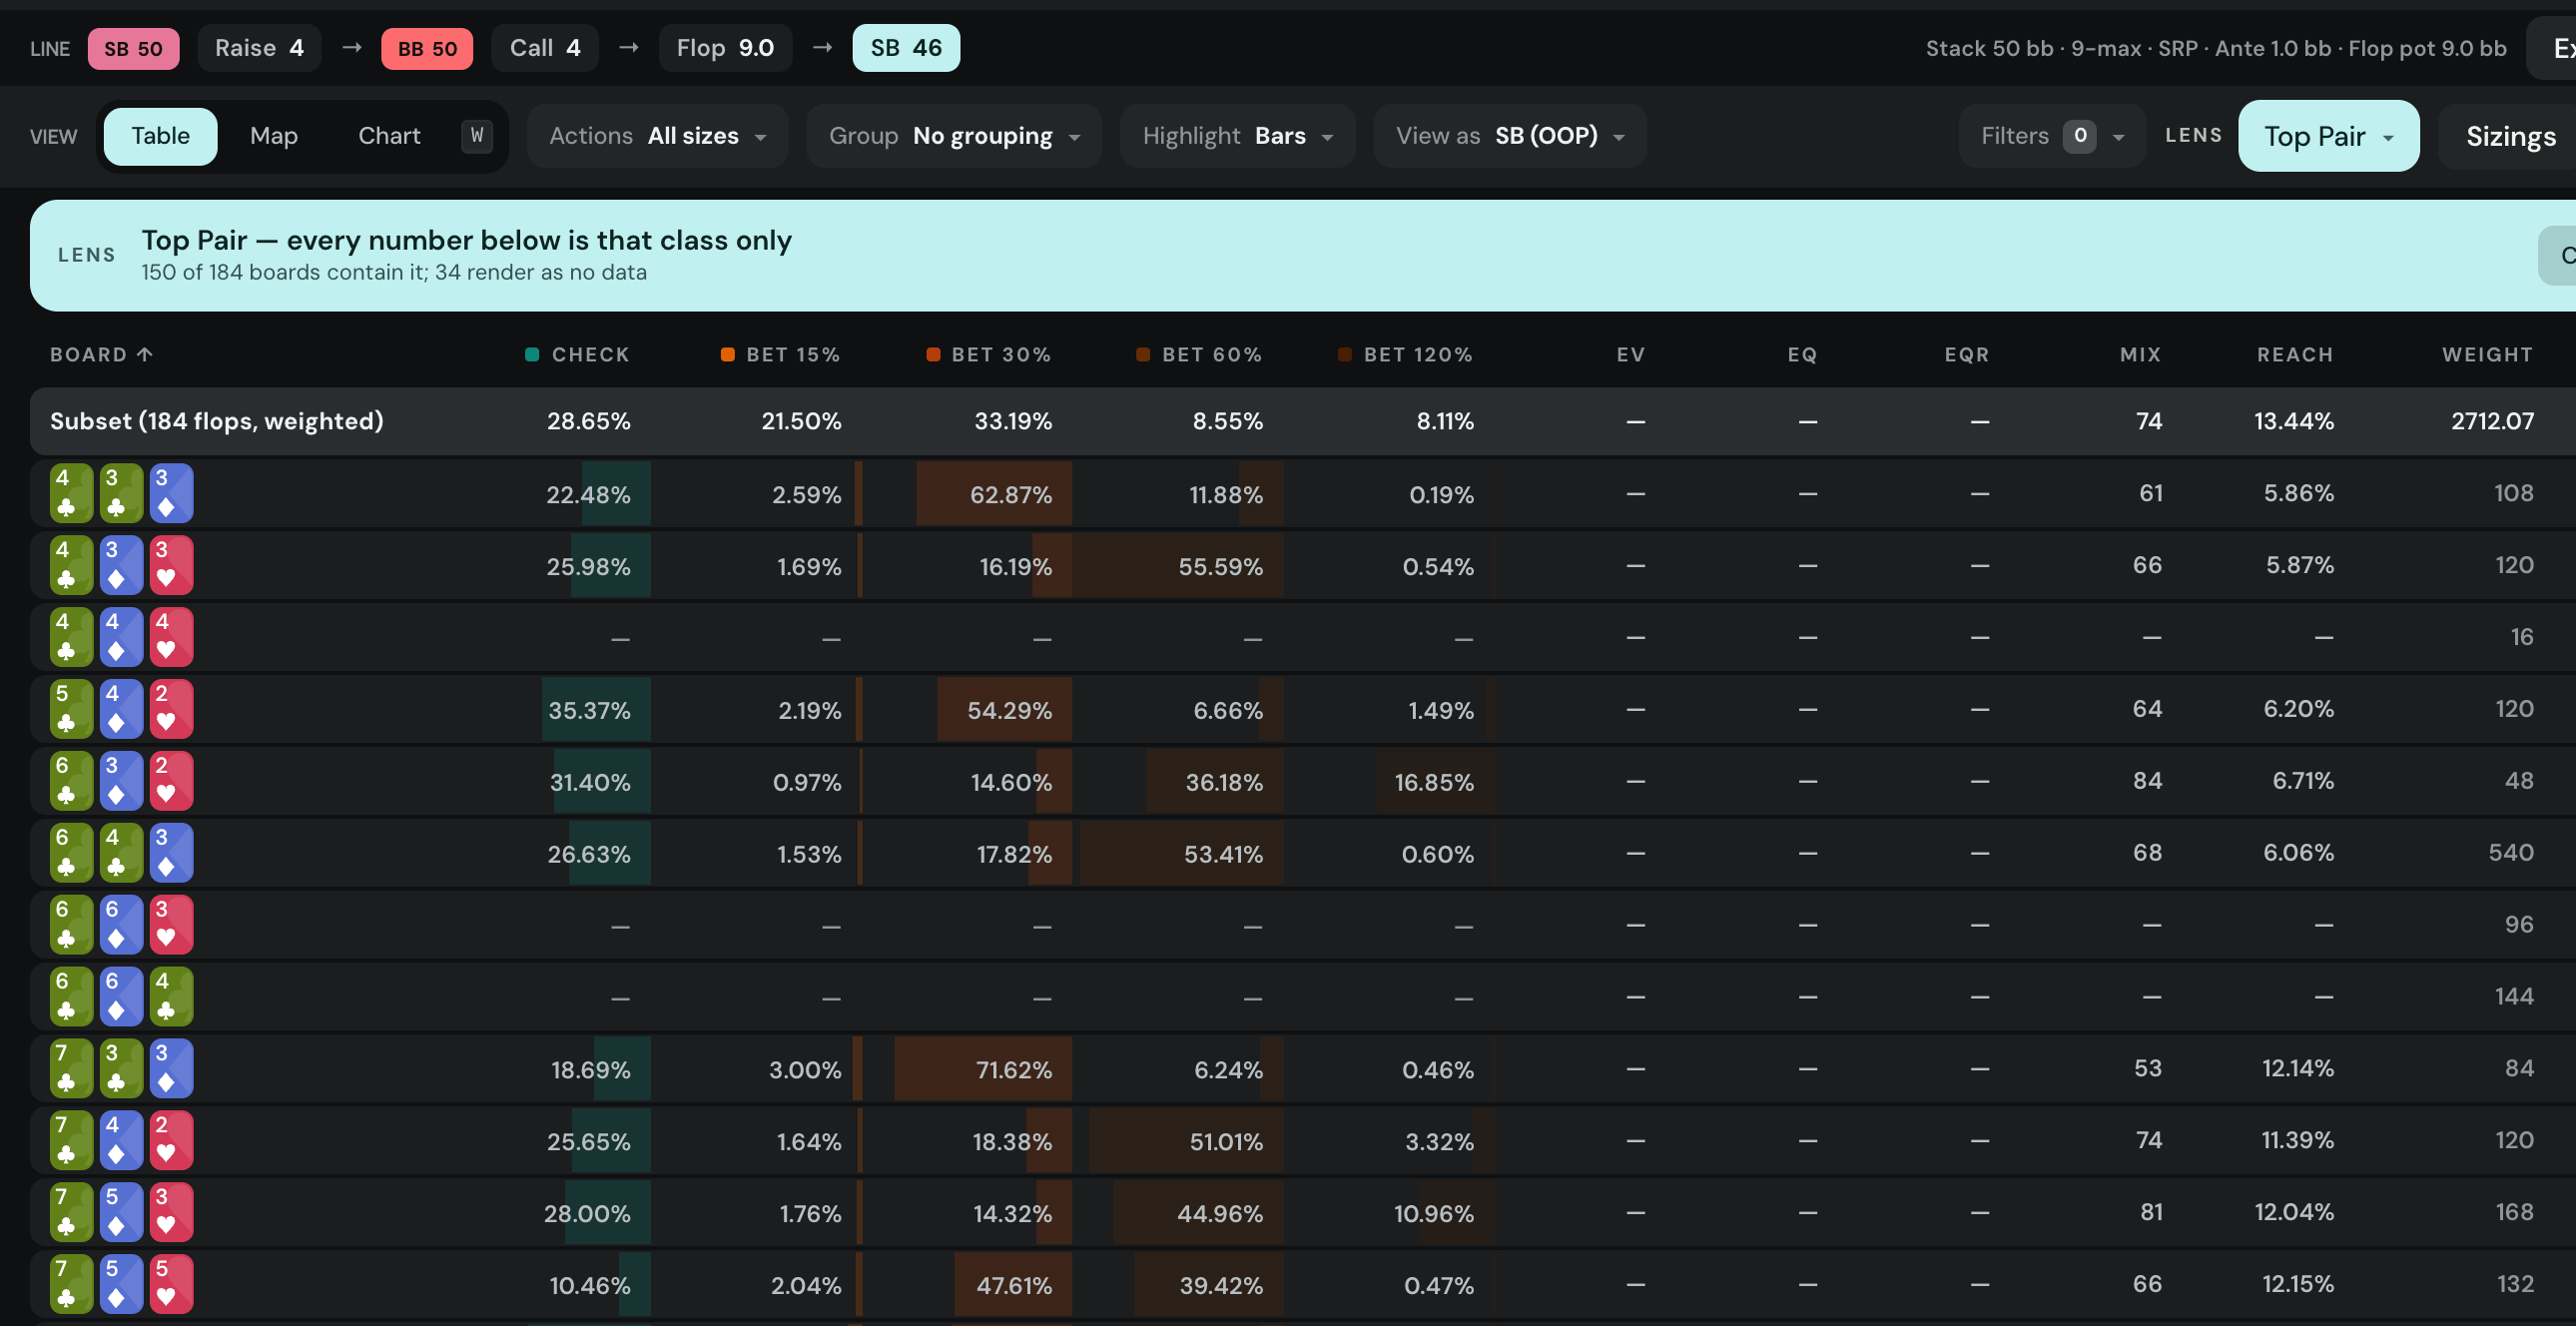 Top pair: 150 boards com dados, 34 sem
Quanto custa usar um sizing só?
O Simplify troca a estratégia por uma única ação em todos os boards do escopo, mostra quanto EV ponderado isso custa e depois detalha a opção mais barata por textura.
É uma resposta no nível do range para o spot. Não diz o que fazer com uma mão específica.
Medido contra um oponente GTO fixo: cada número é um piso. Um oponente que perceber que você sempre repete a mesma ação vai explorar isso ainda mais.
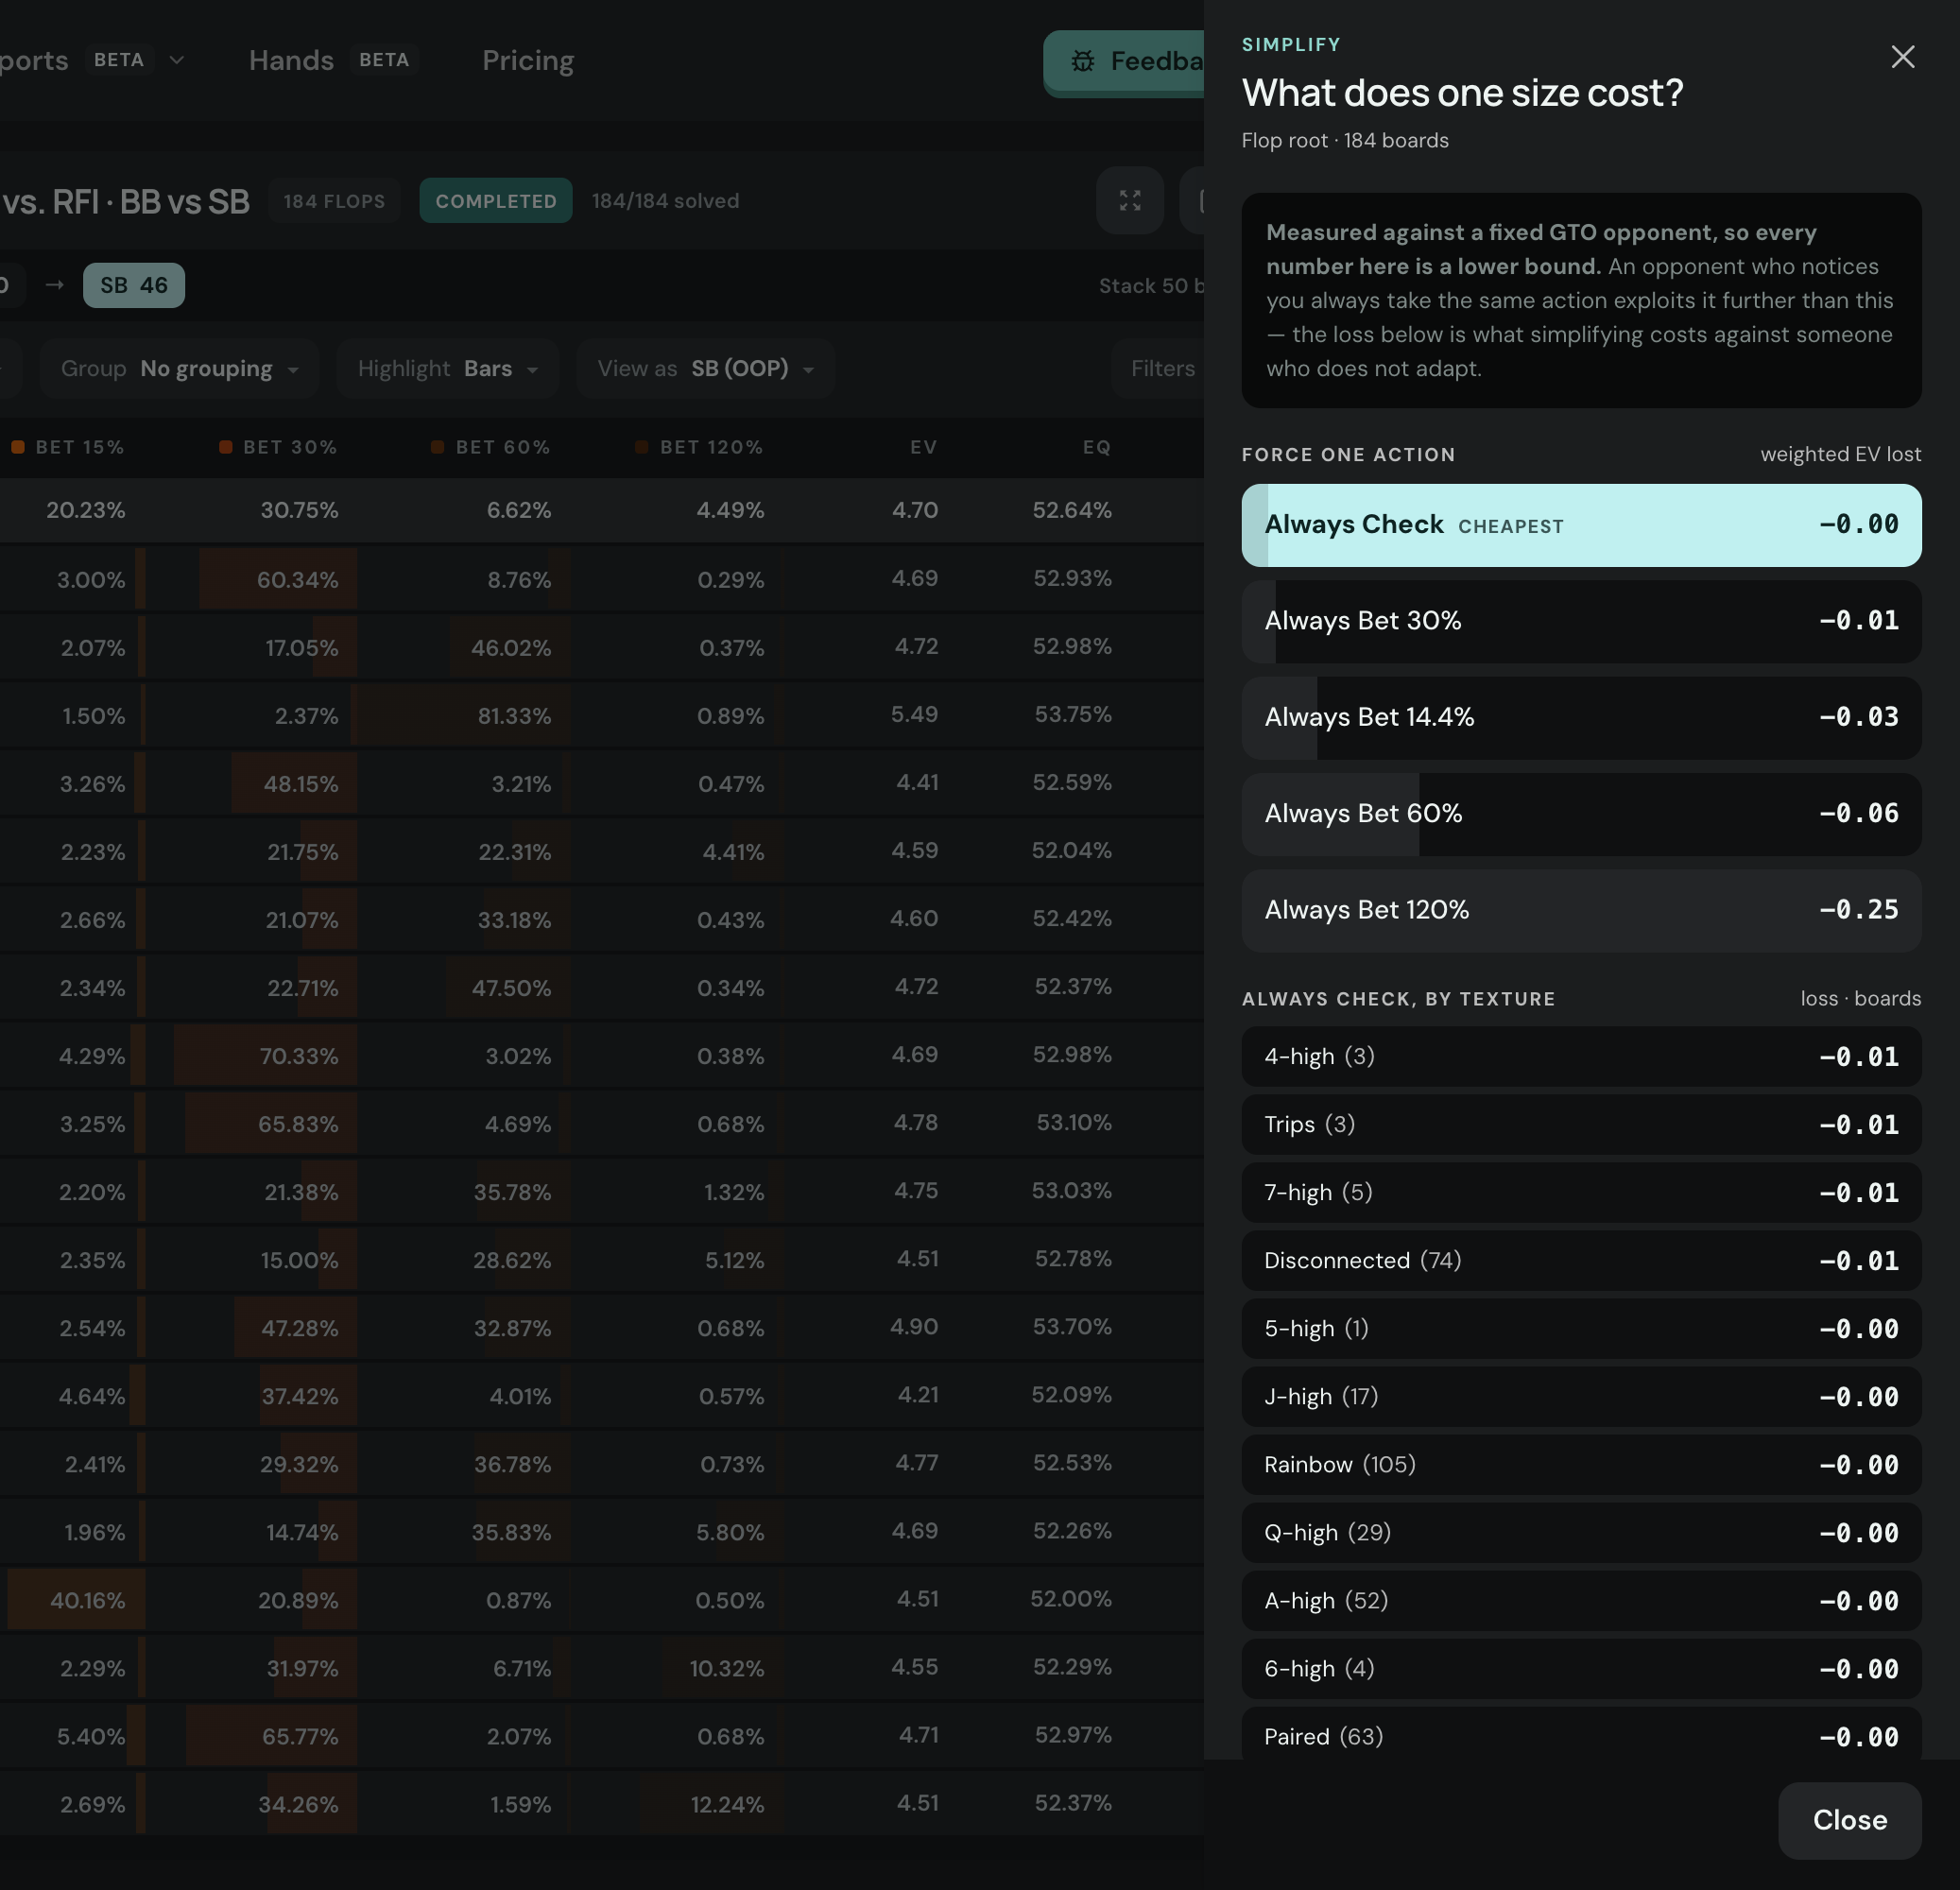 Cinco estratégias simplificadas e a perda de EV ponderada de cada uma, com o mesmo aviso no topo
Além do flop, e lado a lado
A partir de um flop resolvido, gere um relatório de cada carta do turn no nó em que você está. A mesma tabela, uma linha por turn.
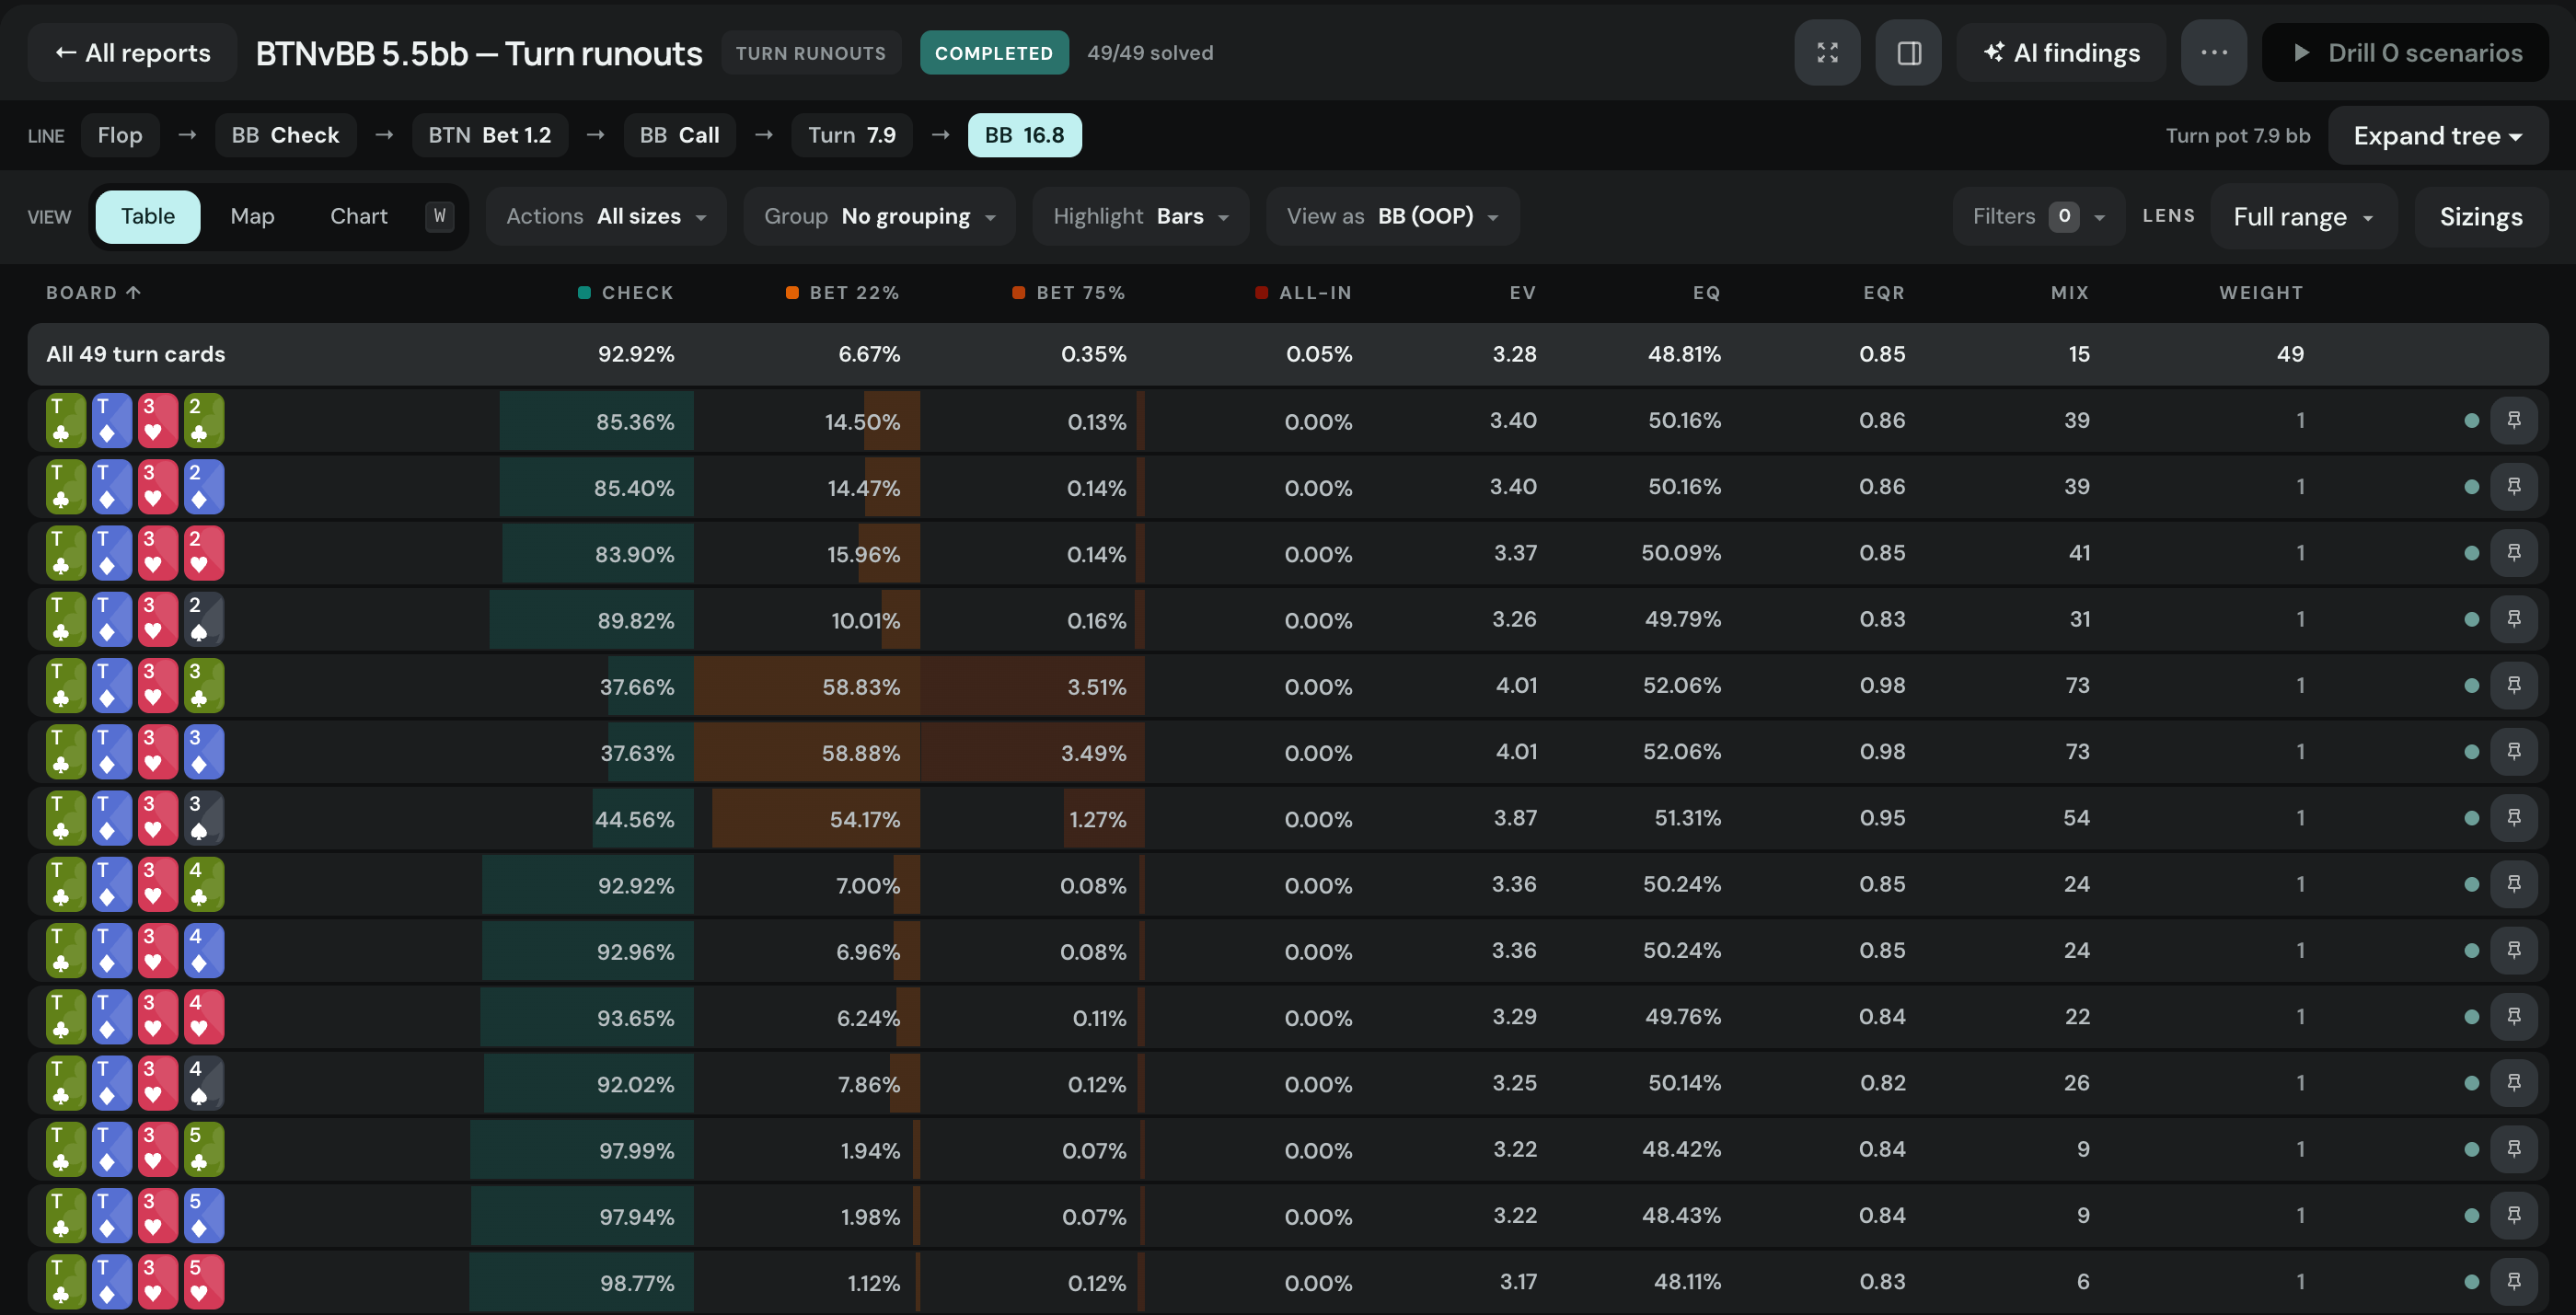 49 turns sobre T♣T♦3♥
Dois relatórios da mesma street, board por board, com as linhas de ação alinhadas, as maiores divergências listadas e um drill só com esses boards.
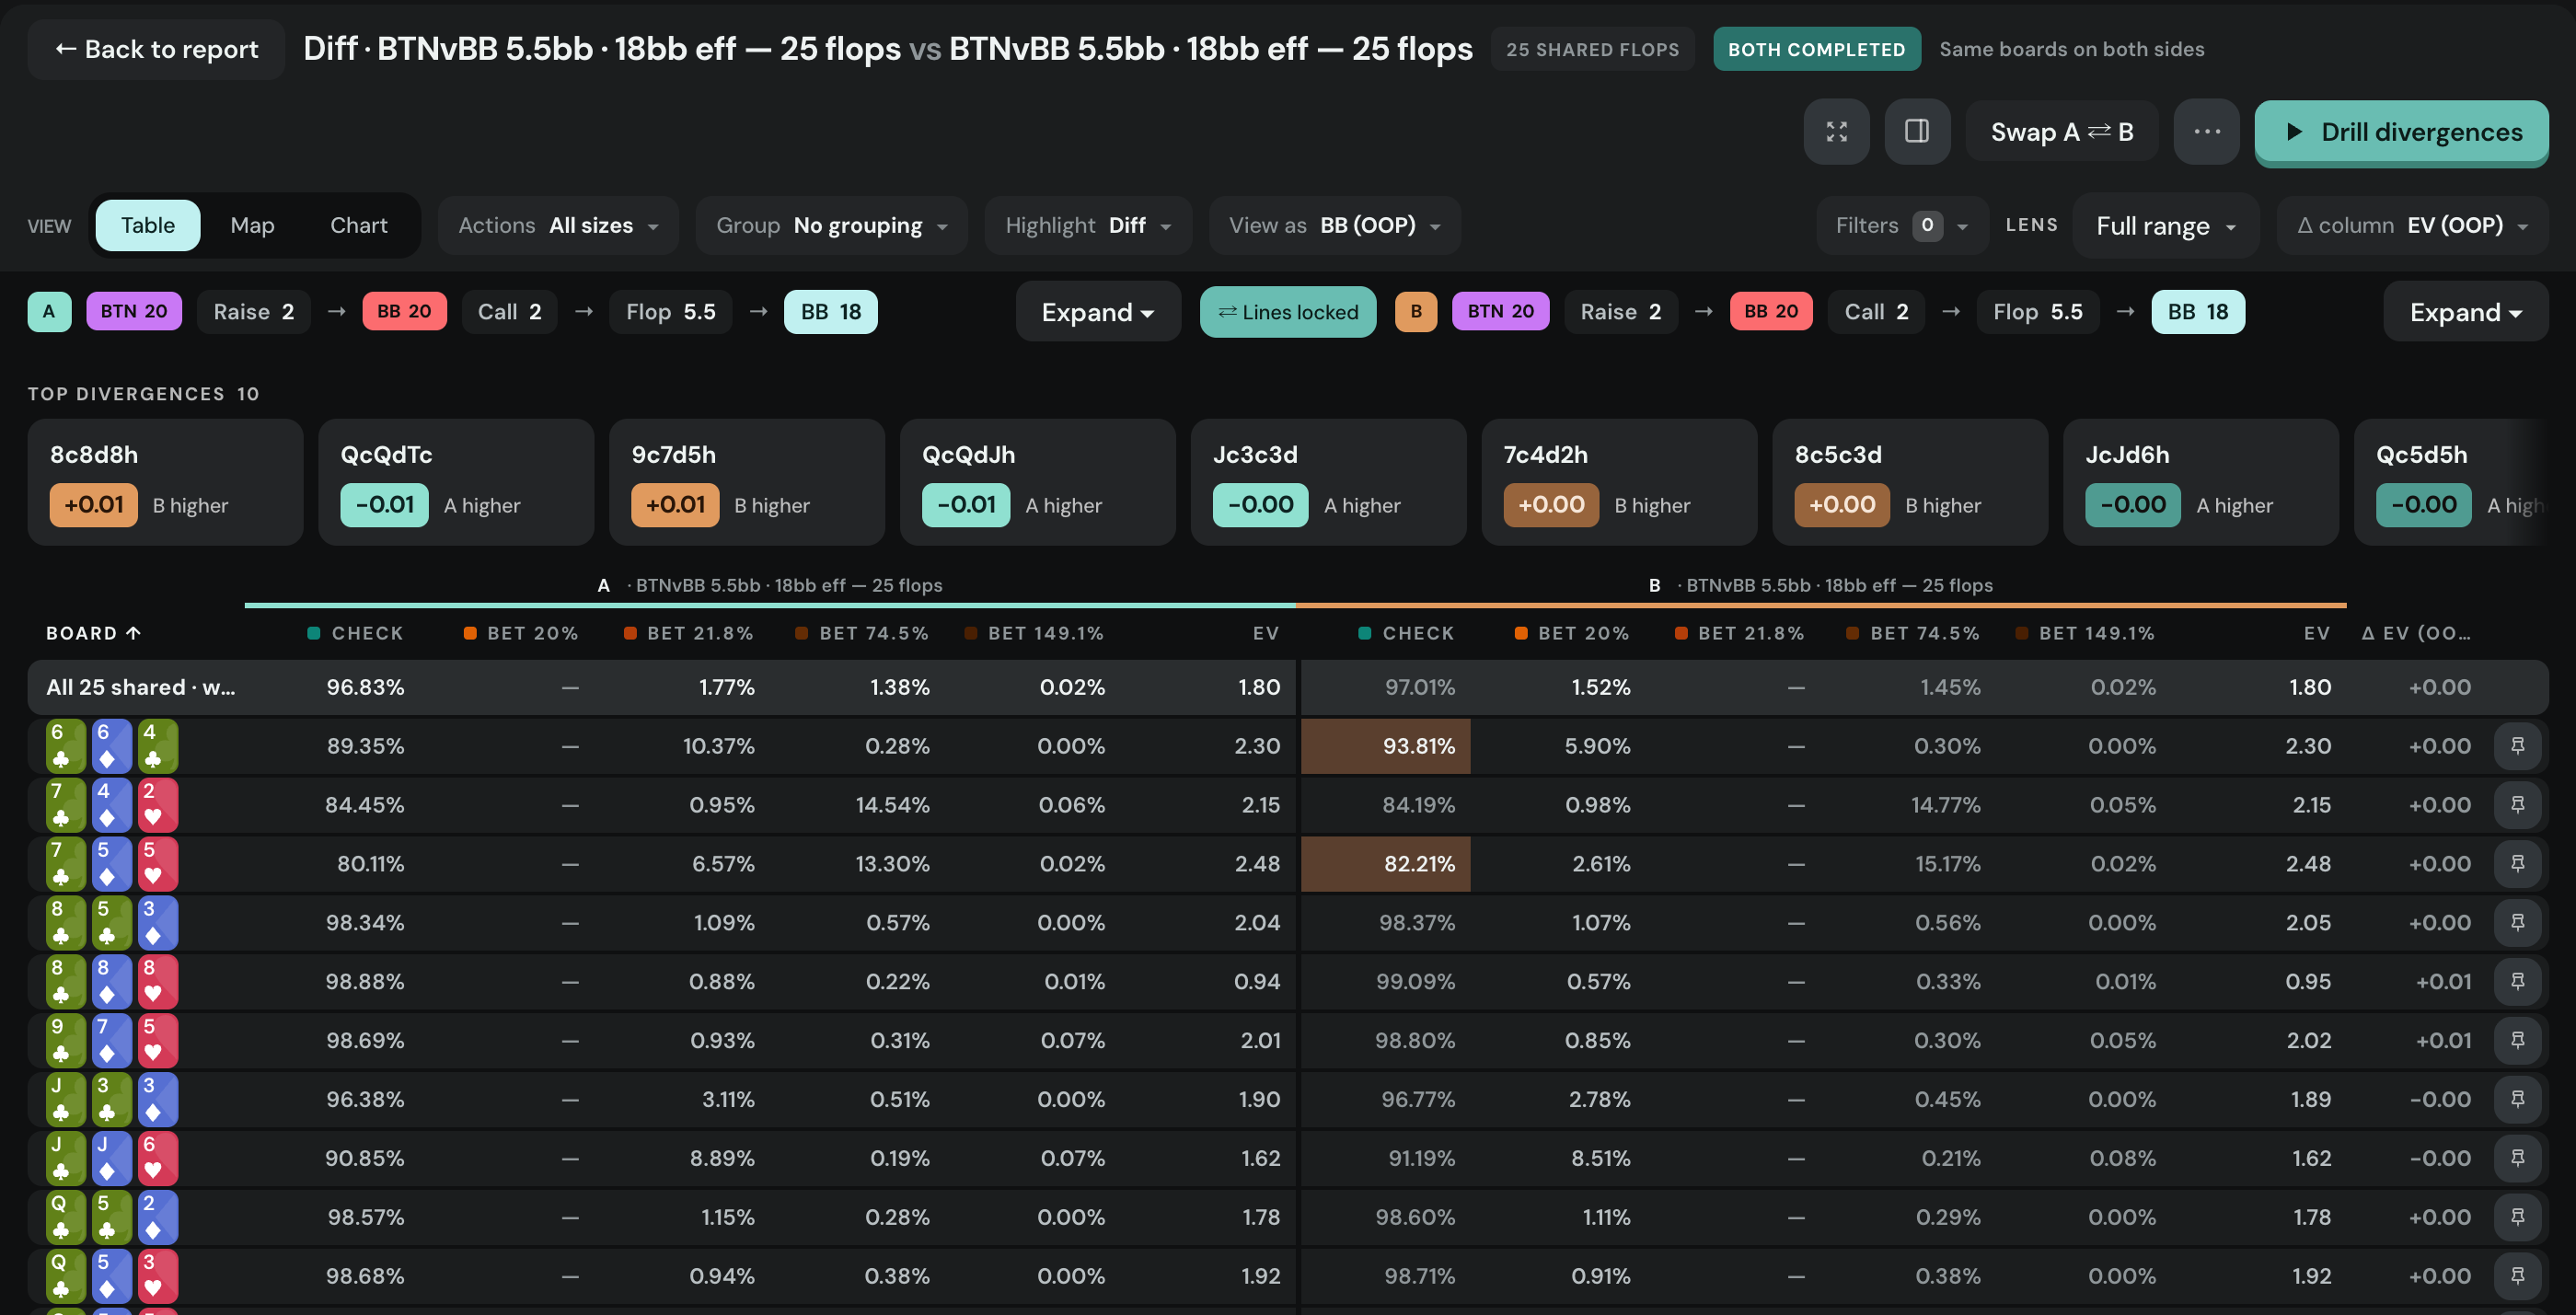 Dois menus de sizing, uma tela
Depois, jogue
O Drill N scenarios manda os boards do escopo para o trainer como decisões isoladas neste nó, cada uma com nota. Um filtro de flops monotone vira onze mãos em flops monotone.
Como o trainer avalia uma decisão →Você não precisa montar nenhum
Tudo o que você montou, mais as cópias dos relatórios que você duplicou.
Só leitura. Duplique um para ter a sua cópia e mexer nela.
Relatórios que outros usuários decidiram compartilhar.
Um por spot de pré-flop, a partir dos solves que mantiveram o pote, os stacks e os ranges desse spot. Públicos, só leitura, listados quando cobrem pelo menos 10 flops.
O que cada plano tem
Os relatórios públicos feitos com os solves de todo mundo.
1 por diaQualquer spot, no escopo que você escolher.
Até 200 boardsO conjunto completo de flops e mais de um relatório rodando ao mesmo tempo.
2 ao mesmo tempoRelatórios agregados
Abra um relatório Official de um spot que você joga todo dia, leia a linha ponderada e vá filtrando até a regra quebrar.
Começar teste grátisPremium completo por 3 dias. Cancele em 2 cliques, sem taxa.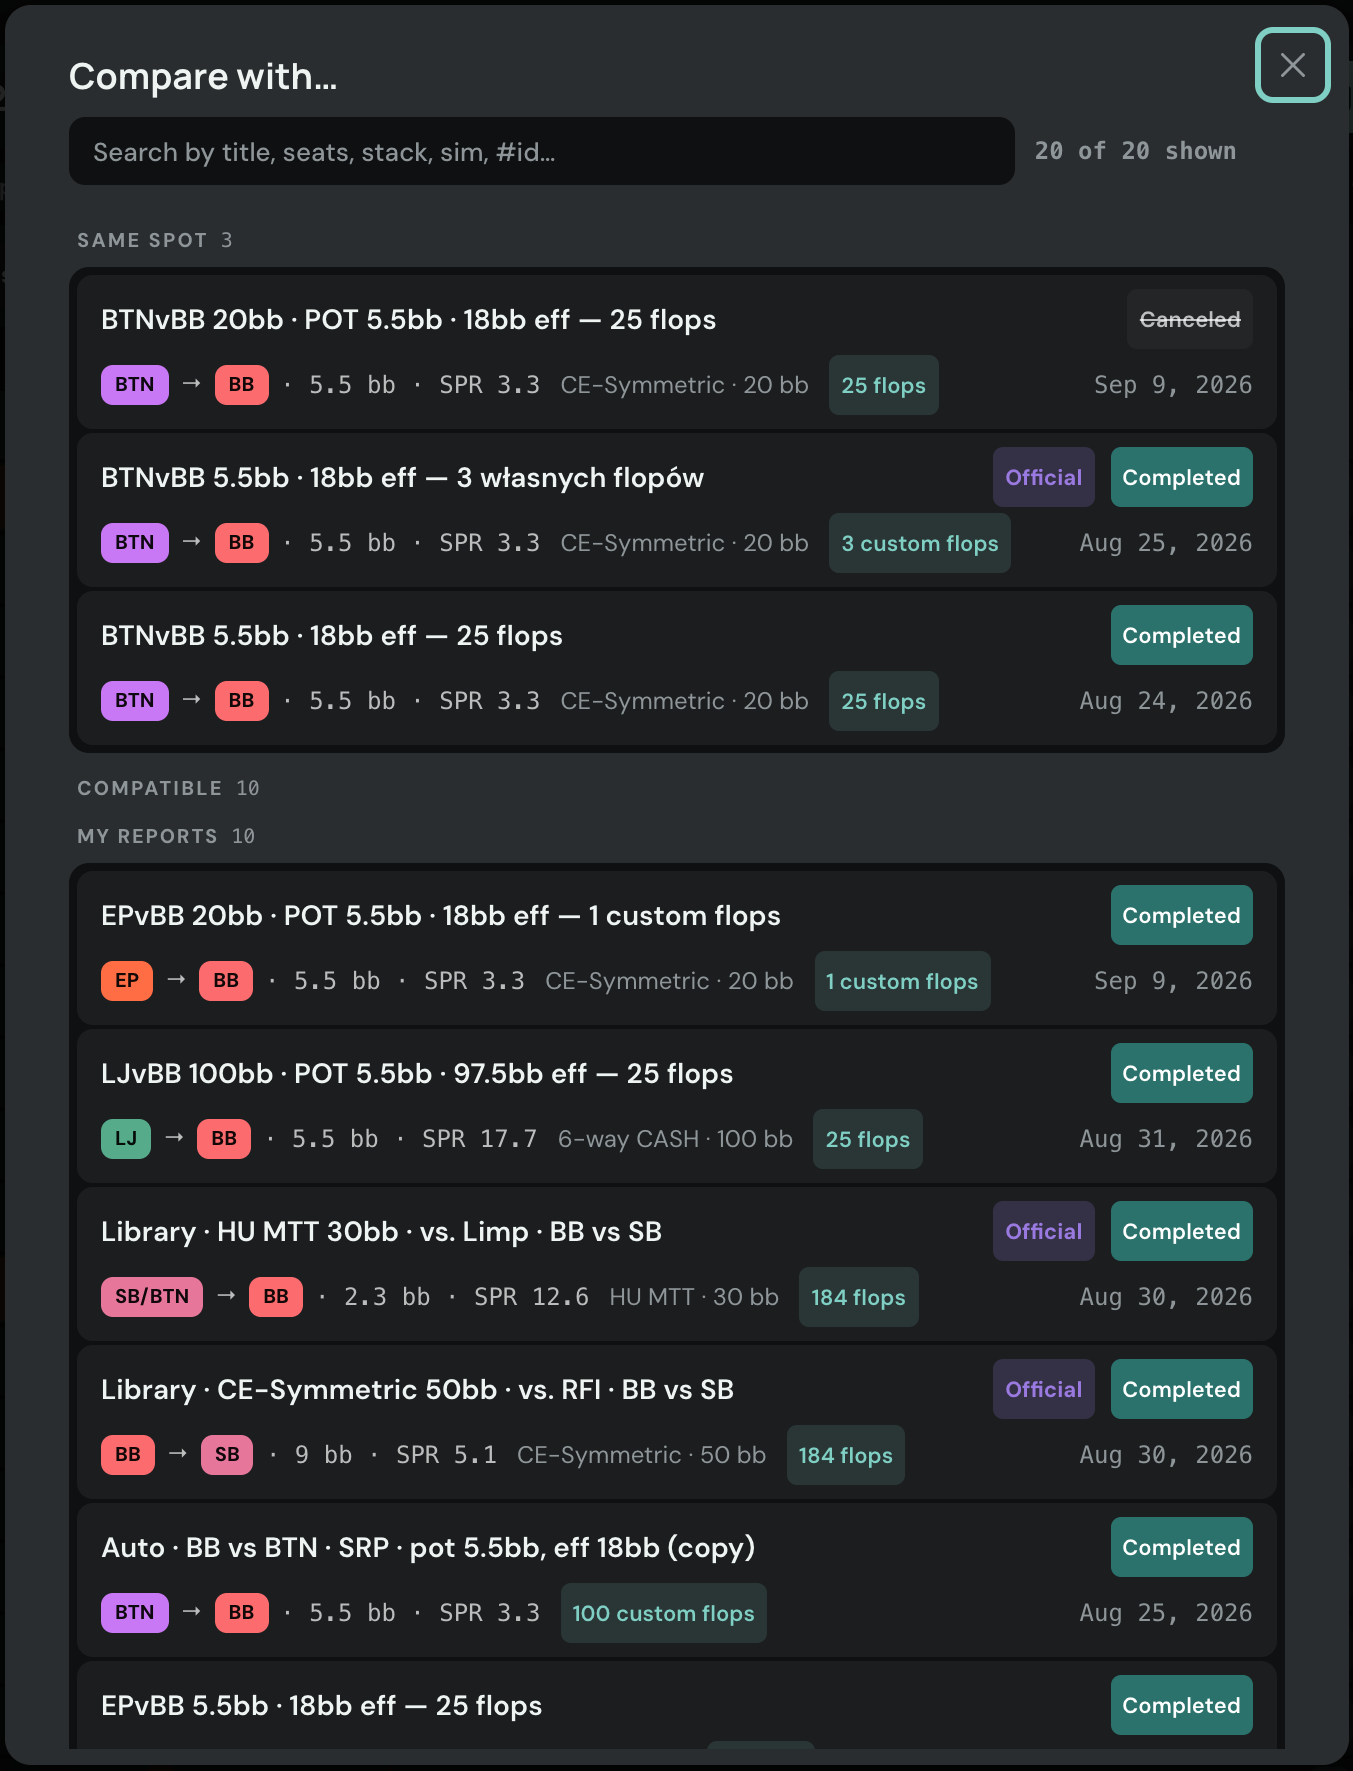 Compare with: primeiro o mesmo spot, depois os compatíveis