

Poker variance in tournaments: downswings, breakeven stretches and the bankroll you actually need
 Kamil Brzozowski
Product Designer
Updated· first published ~9 min read
A tournament player with a 20% ROI can play 1,000 tournaments and still be losing. In my model that happens to one player in five, and those players are winners with a real edge who didn’t hit the right final tables.
That is variance in MTTs. This article puts numbers on it: how deep downswings go, how long you can run breakeven while winning, and how big a bankroll has to be before those swings stop being dangerous. Then the harder part, getting through a long flat stretch without breaking your game.
The model, and what it assumes
Everything below comes from a simulation I wrote for this article. It is a model, not real players’ results, and it only knows what I told it:
- Payouts: the payout tables our variance calculator uses, 15% of the field paid, for fields of 100, 500 and 2,000 runners.
- Cost: $10+$1, so one buy-in is $11 and about 9% of it is rake. ROI is measured on the full $11.
- Skill: a player with ROI r finishes in each paid place 1.1 × (1 + r) times more often than a random entrant. Otherwise he busts and loses the buy-in.
- Sample: 1,000 tournaments per career, 5,000 simulated careers per row, one fixed random seed (20260915), so anyone can rerun it.
Real life is noisier. Your ROI changes over time, you mix field sizes, and a player whose edge shows up as deep runs rather than min-cashes swings even harder. Treat the numbers as a floor for how rough it gets, not a ceiling.
Start with one tournament. In a 500-runner field, 75 places are paid and first place pays 111 buy-ins ($1,225 of a $5,000 prize pool). The 20% ROI player cashes this often:
Chance to cash, 500 runners, ROI 20%
So he loses his buy-in in 80.2% of tournaments, and most of his profit sits in a handful of deep runs. Lots of small losses and rare big wins is why MTT variance is so much bigger than in cash games. One number measures it, the standard deviation of a single tournament result:
Standard deviation of one tournament
Here pi is the chance of finishing in place i and xi is what that place pays, in buy-ins. The expected profit per tournament is 0.2 buy-ins. The typical swing around it is 7.2 buy-ins, 36 times the edge.
What 1,000 tournaments look like
Every line on that chart is the same player. The expected result after 1,000 tournaments is +200 buy-ins. Across all 5,000 simulated careers the middle 90% ended between -161 and +593 buy-ins, and 20% were still losing.
Look at the shape of the lines too: long slow slides down, then a vertical jump. A slide of 100 or 200 buy-ins is the normal distance between two deep runs.
How deep the downswings go
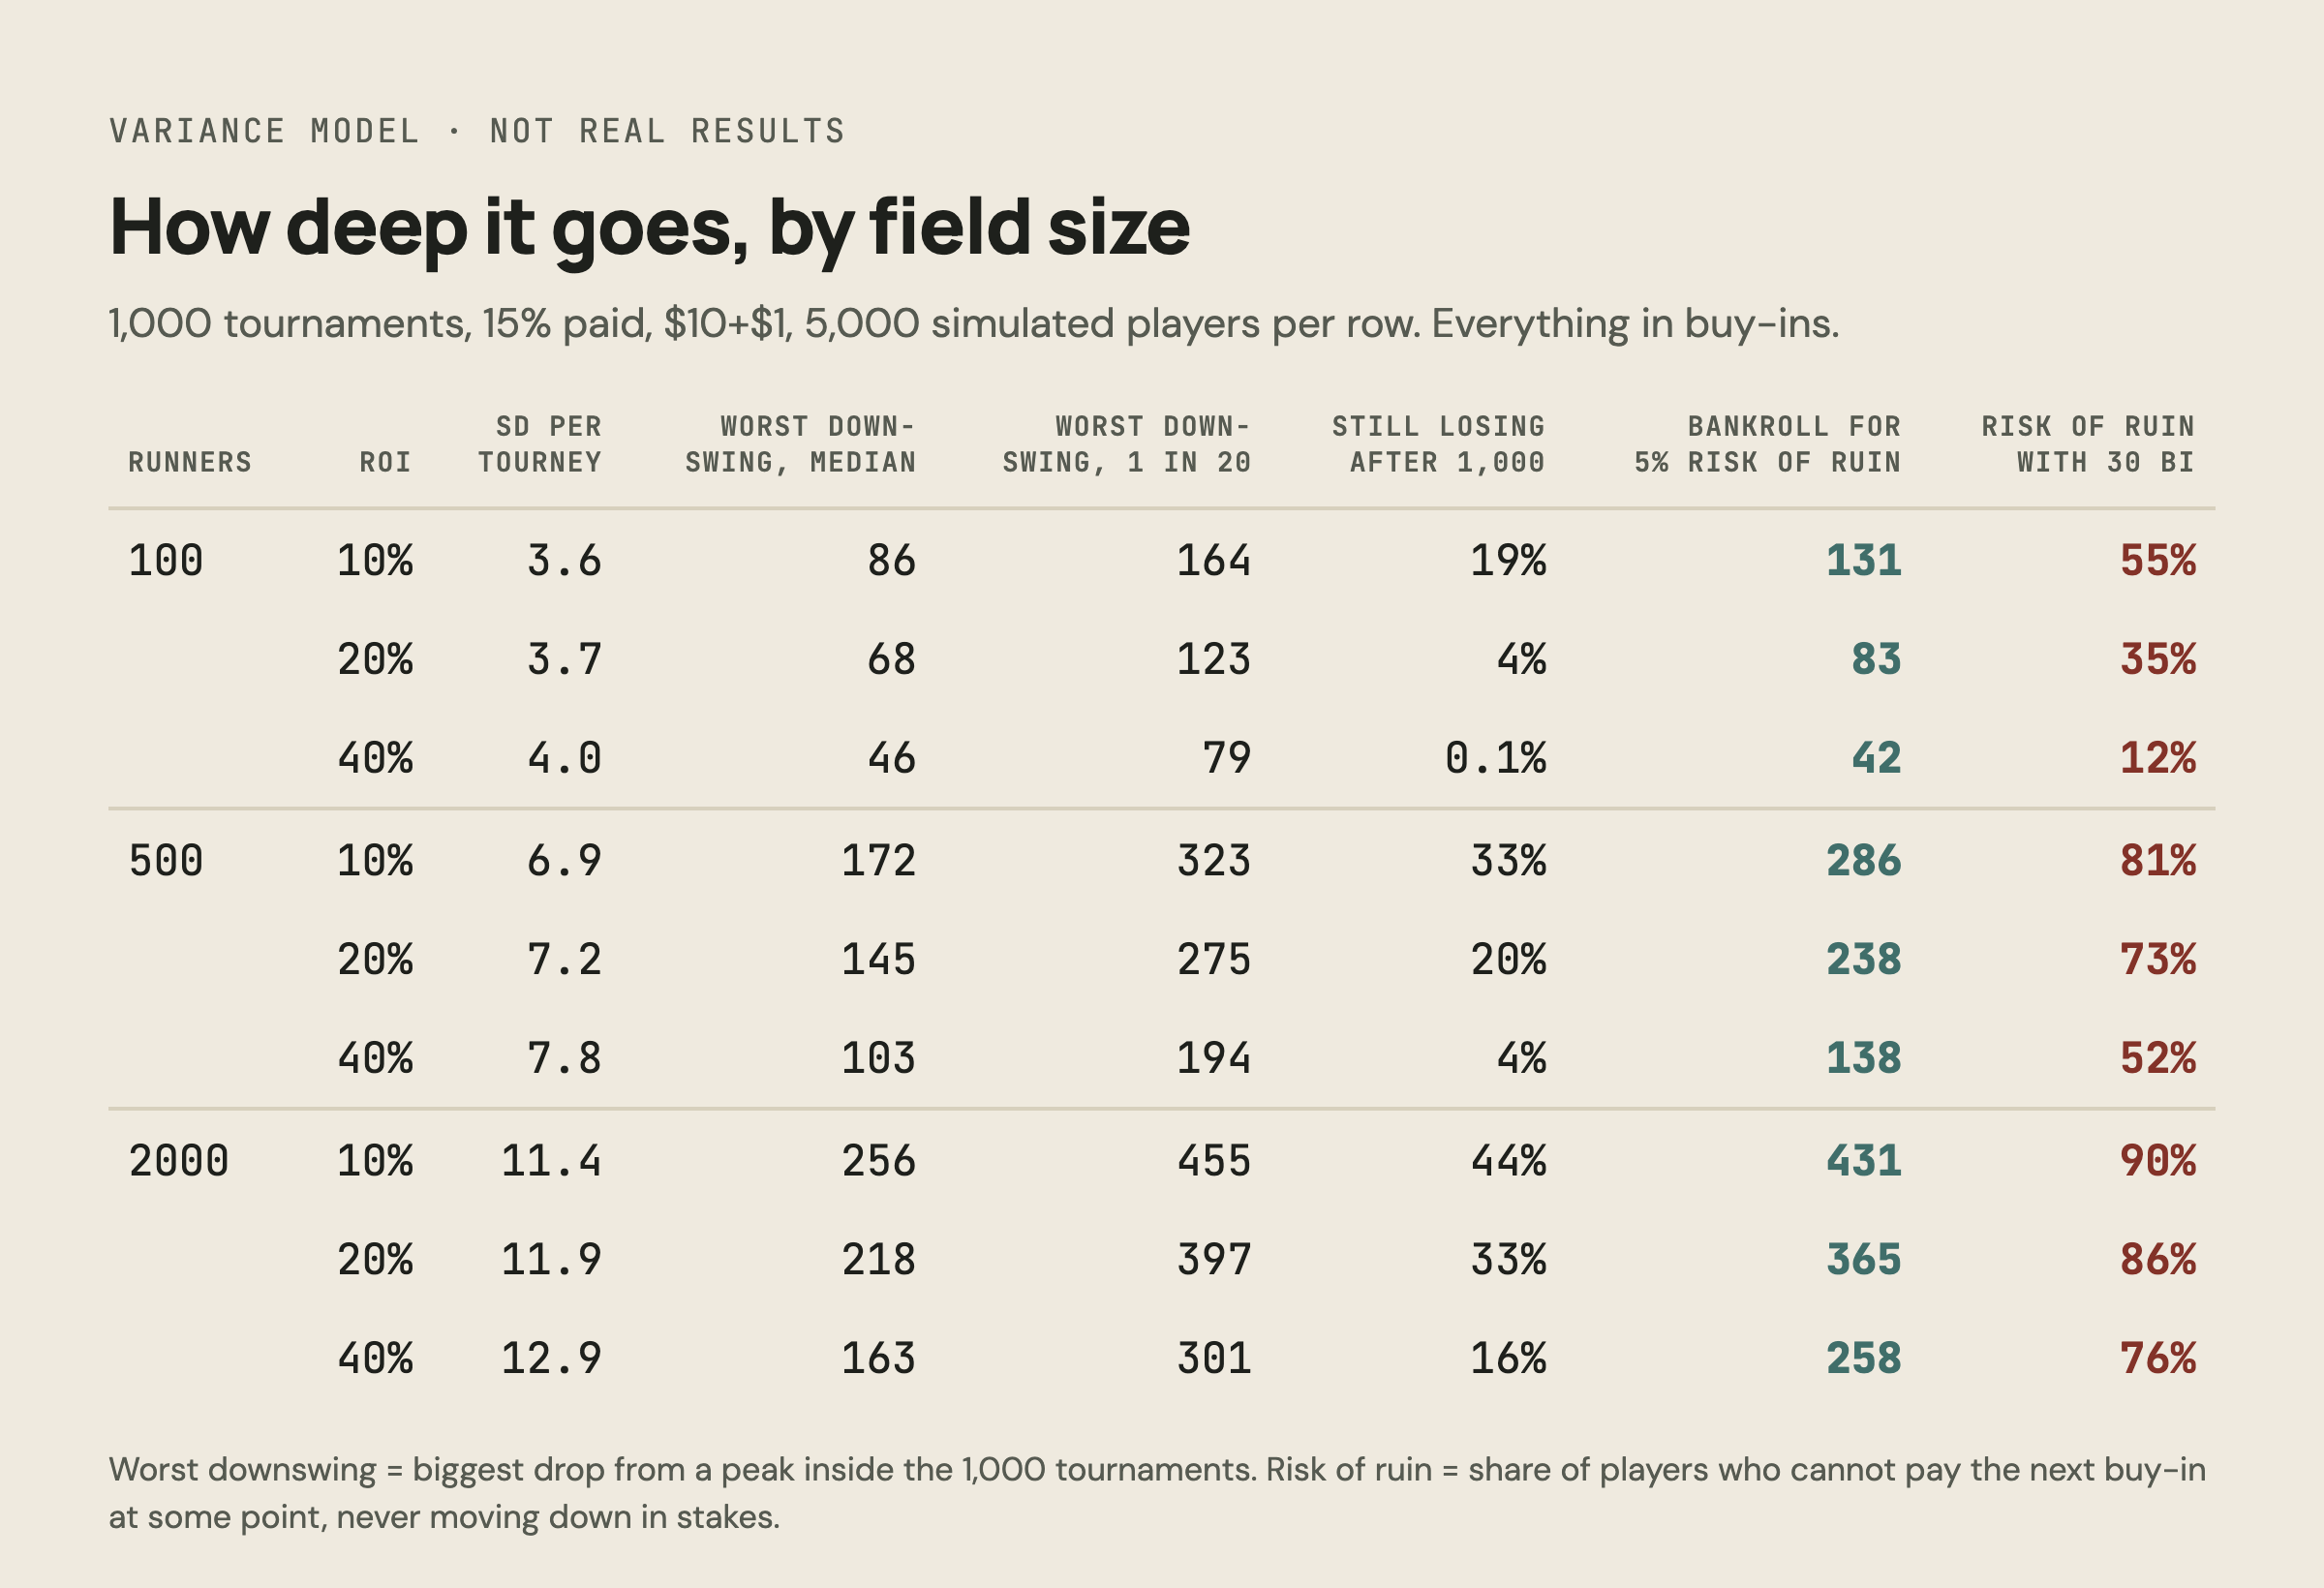
For the 20% ROI player in 500-runner fields, the worst downswing inside 1,000 tournaments was 145 buy-ins for the median career. One career in twenty saw 275 buy-ins or worse. Three things stand out in the table:
- Field size matters more than skill. A 40% ROI player in 2,000-runner fields (163 buy-ins median downswing) swings harder than a 10% ROI player in 100-runner fields (86).
- The standard deviation barely depends on ROI. It grows with the field: 3.7, 7.2 and 11.9 buy-ins at 100, 500 and 2,000 runners.
- 1,000 tournaments is a short run in big fields. At 2,000 runners and 20% ROI, 33% of winners are still down.
30 buy-ins is not a tournament bankroll
An older version of this article said a bankroll of 20 to 30 buy-ins was enough. That is a cash-game number, where a buy-in is 100 big blinds and the swings are far smaller next to it. For tournaments it is wrong, and the model shows by how much.
Risk of ruin here means starting with a bankroll, never moving down, and hitting a point in the 1,000 tournaments where you can’t pay the next buy-in. With 30 buy-ins, that happened to 73% of the 20% ROI players in 500-runner fields. With 100 buy-ins, still 32%. To bring it down to 5% they needed 238 buy-ins, and 317 for 1%.
Play this spot instead of reading about it
Start Free TrialThe trainer deals the situations this article describes and grades every decision you make. Try it free for 3 days.
In small fields it’s gentler: 83 buy-ins for the same 5% at 100 runners. In 2,000-runner fields, 365. So a rough rule, straight from this model: 100 buy-ins is a floor for small fields, and big-field players need several hundred unless they have a way to move down.
Moving down is that way out. The model never lets anyone drop stakes, which is why its numbers are harsh. A clear rule like “below 150 buy-ins I play the next level down” cuts real risk of ruin a lot, though this model can’t tell you by how much. Smaller fields help too, and so does selling action or swapping, which gives up part of your upside for smaller swings. What doesn’t help: playing tighter because you’re running bad. That changes your strategy because of luck, and it lowers your ROI without touching the variance.
You don’t know your ROI yet
The table assumes the player knows his true ROI. Nobody does. Your results are one sample, and with a standard deviation of 7.2 buy-ins that sample is very wide:
95% range of your measured ROI after n tournaments
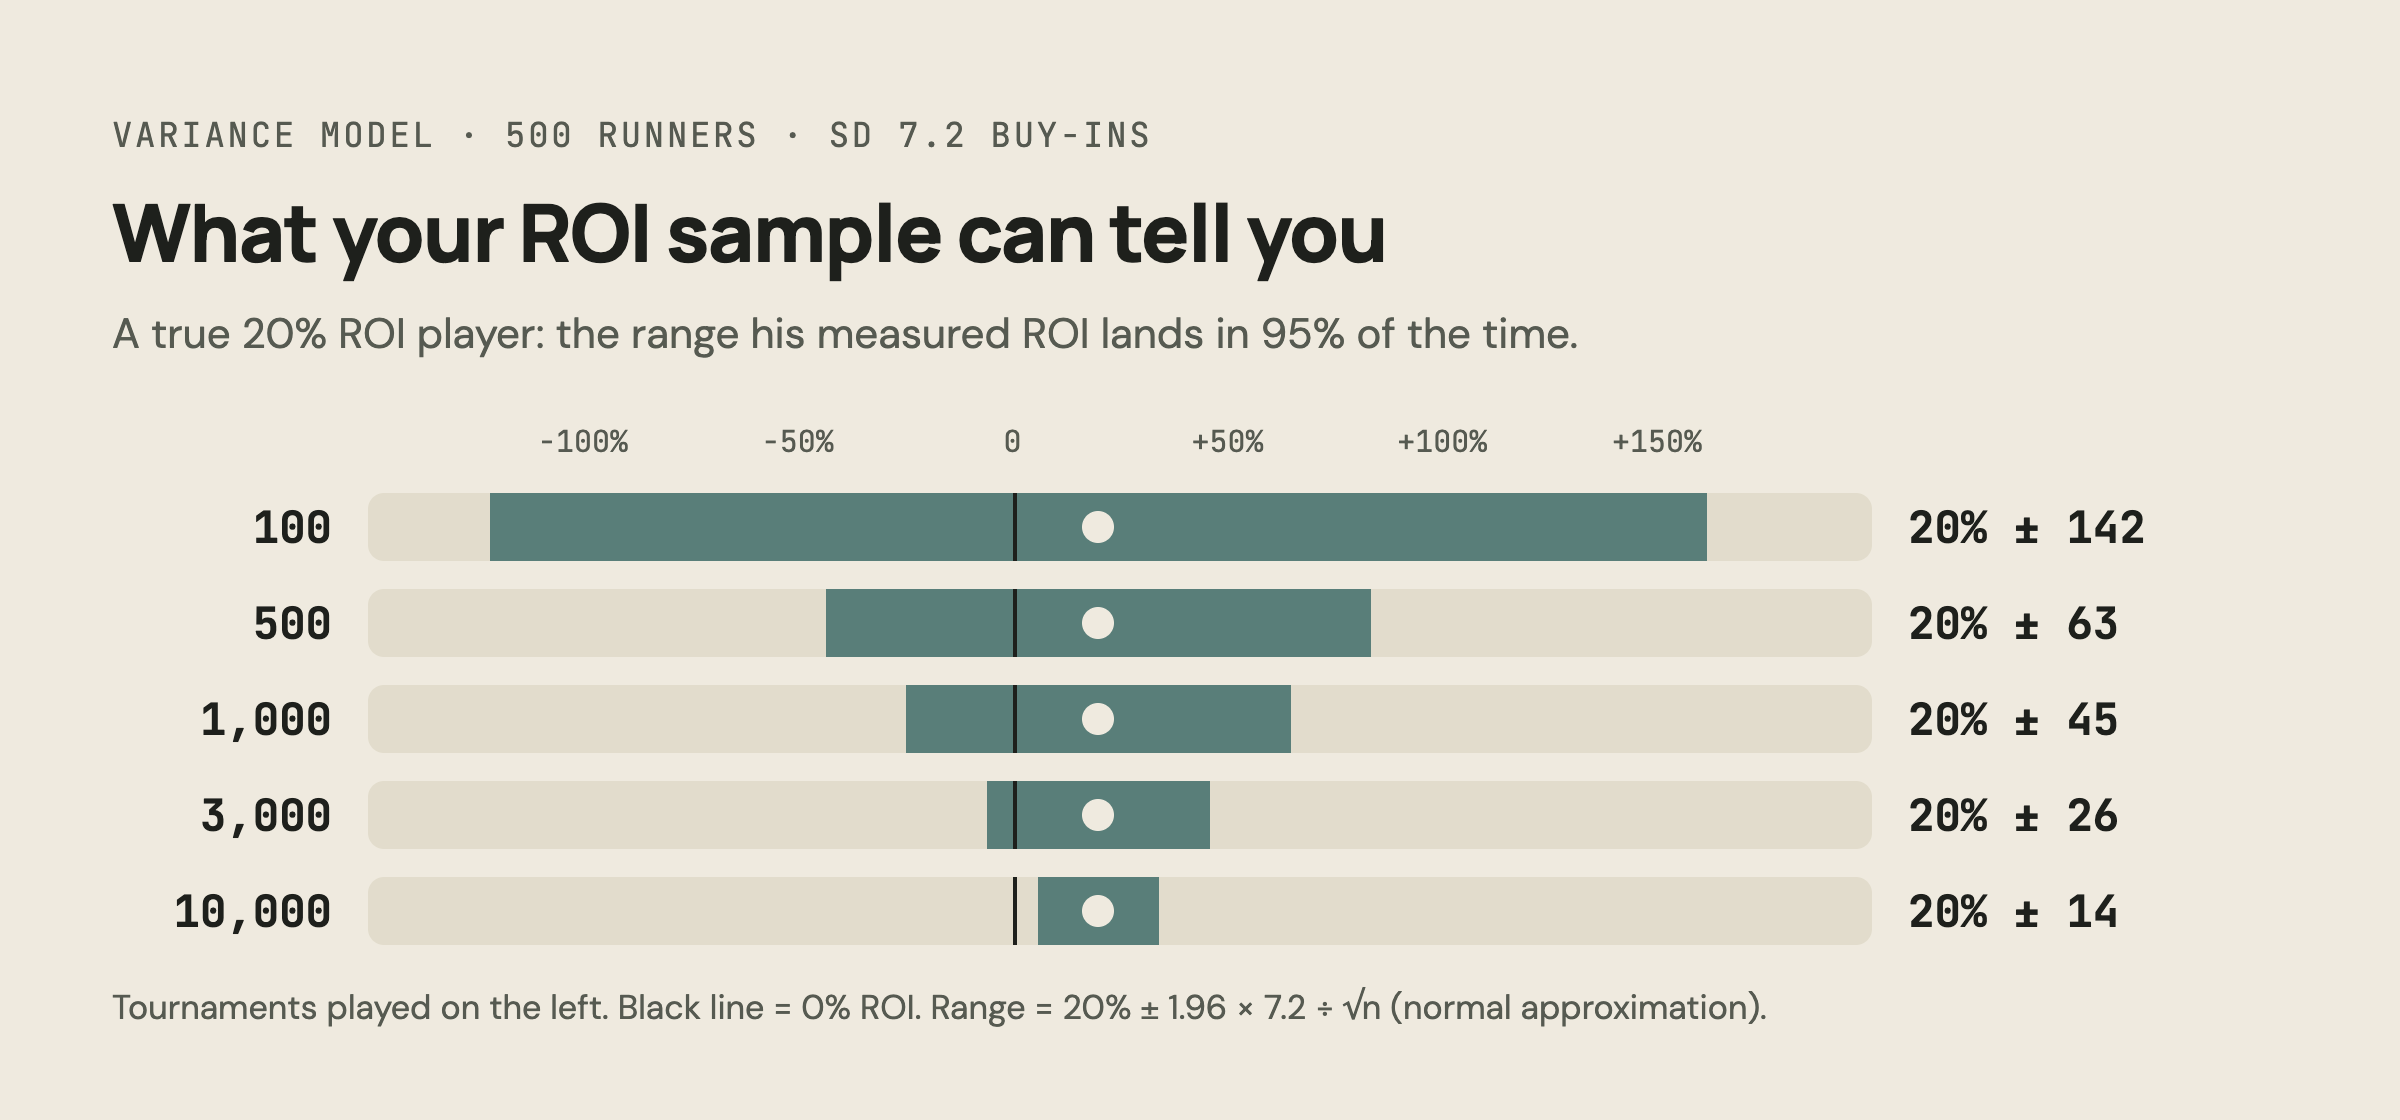
After 500 tournaments a true 20% player shows anything from −43% to +83%. After 1,000, still ±45 points. To be 95% sure the result is above zero, he needs about this many:
Tournaments until a 20% ROI shows as profit (one-sided 95%)
At 20 tournaments a week that’s over three years. It cuts the other way too: a player who is actually breakeven can show a 40% ROI over 500 tournaments and believe he’s crushing.
Breakeven stretches happen to winners
A breakeven stretch is a run of play that ends no higher than it started. For the 20% ROI player in 500-runner fields, the longest such stretch inside 1,000 tournaments was 721 tournaments for the median career, most of the sample. There is a selection effect on top of that: 49% of these winners lose over their first 100 tournaments, while every one of the 5,000 simulated careers had some losing 100-tournament window somewhere in the 1,000.
A calculator question like “what are the odds I lose over the next 100?” has a comfortable answer. “What are the odds I go through a bad 100 somewhere?” is almost certain, and that is the question worth asking.
Cash players get the same thing in hands. I ran the same kind of model for a cash winner at 5 bb/100 with a standard deviation of 100 bb/100 (an assumption, yours may be higher) over 1,000,000 hands. The median longest breakeven stretch was 165,000 hands, and 92% of these players went through at least 100,000 hands of zero profit.
The numbers are easy to misread. A long flat stretch is consistent with being a winner, and it does not prove that you are one: a breakeven player draws exactly the same graph. The graph can’t tell you which one you are, so stop asking it.
Judge the decisions, not the graph
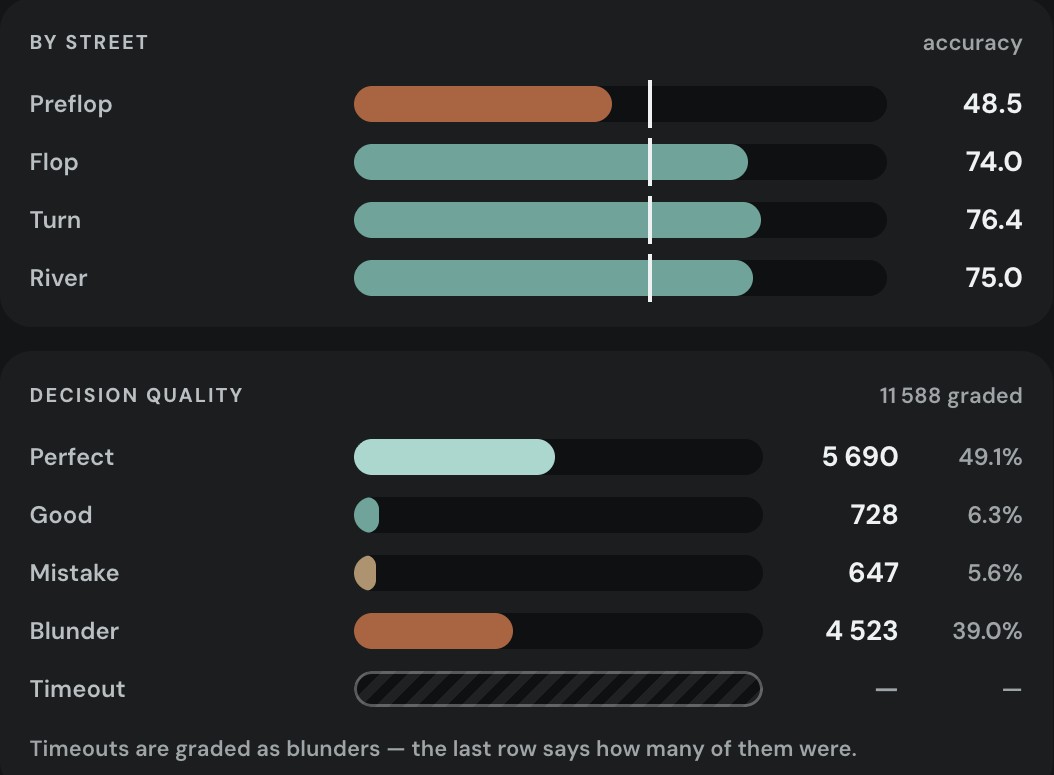
If results are this noisy, the only fast feedback you get is on decision quality, which doesn’t swing with the cards. In Practice, every decision is graded against the solver, so the Performance tab shows accuracy and EV loss per decision instead of money won.
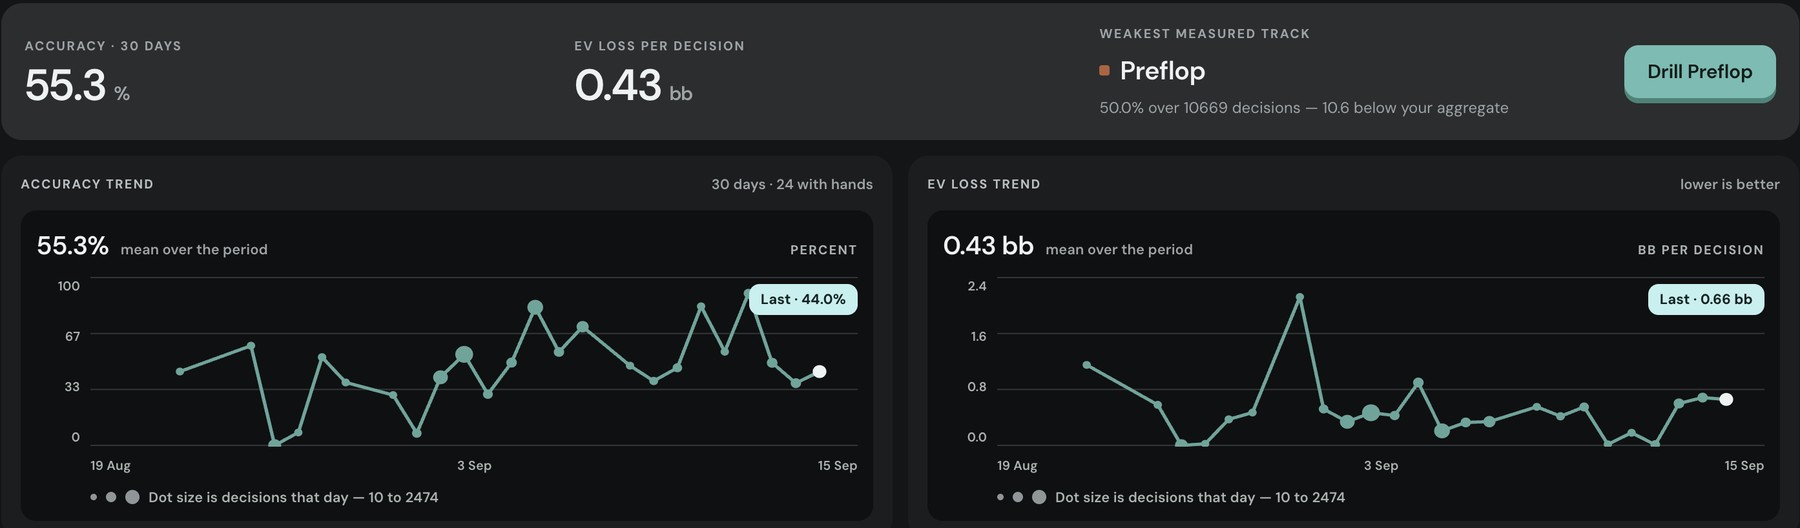
Practice grades your training decisions, not your real sessions, but it’s the cleanest read on how you decide. EV loss per decision is the number to watch during a downswing. If it stays flat while your bankroll drops, you’re running bad. If it climbs, you’re playing worse, and that part is yours to fix.
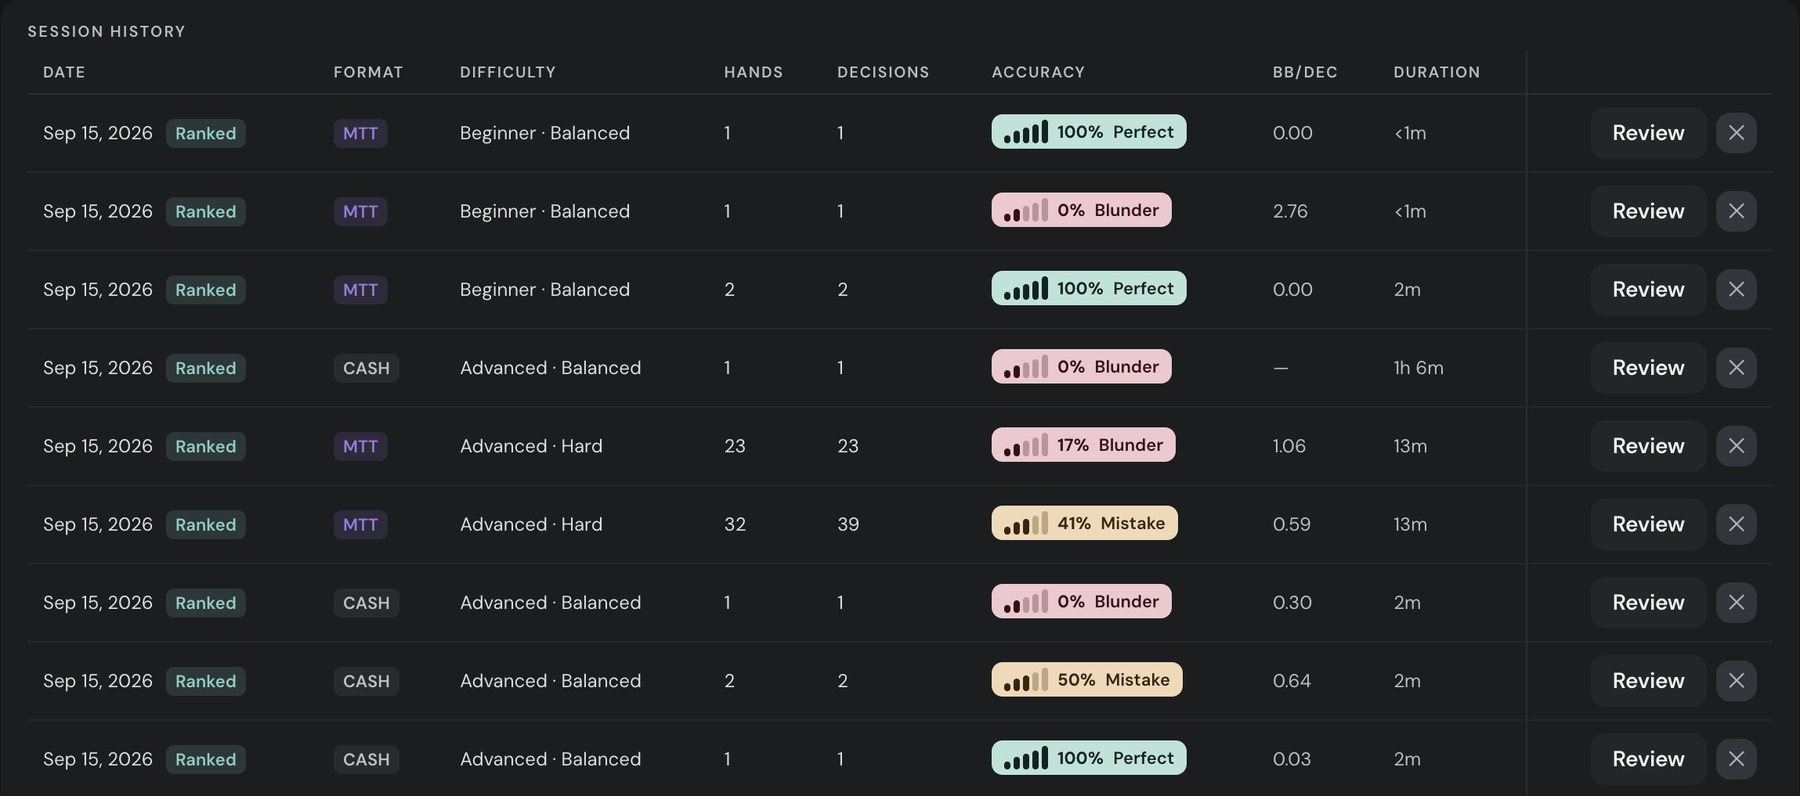
Session by session, the History tab does the same. Each session gets an accuracy grade and a bb-per-decision loss, whether you won the hand or not.
Getting through a long flat stretch
The maths is the easy part. The hard part is that a long breakeven stretch changes how you play, and that’s what turns variance into a real loss. Jared Tendler’s The Mental Game of Poker describes it with the A-game and C-game: your best and your worst version at the table. The swings don’t touch your A-game. They drag out the C-game: forcing spots, calling to “get unstuck”, playing longer sessions than you should, moving up to win it back.
What I’d do, in order:
- Plan for it before it starts. Pick your bankroll and your move-down line now, while you’re calm. Then dropping below that line is a rule you follow, not a decision you make on tilt.
- Keep the strategy, change the stakes or the volume. Tightening up because of bad luck is a results-based mistake; moving down or playing shorter sessions is not.
- Write down your worst decision of each session. A downswing is the one time you reliably see your C-game, and those notes show the leaks better than another week of results.
- Compare your worst to your old worst. Progress often shows as a higher floor, fewer blunders on bad days, long before it shows as a higher ROI.
- Drill the spots, don’t pay for them. Practice the decisions you keep getting wrong away from the tables, where a mistake costs nothing.
The variance is real, and the model says it is bigger than most players plan for. Mostly it decides who quits. Players who bankroll for it, keep their game steady and measure decisions instead of results are still around when the deep run comes.
Cheers! 🙂
Keep reading
All posts
Poker Academy
Stop guessing preflop.
1,500,000+ GTO preflop solutions. Try them free for 3 days.
Start Free TrialCancel anytime.