
Is simplifying poker strategy the road to success? I measured the cost
 Filip PedzichUpdated· first published ~10 min read
“Simplify your strategy” is advice everyone gives and almost nobody prices. Solver charts are full of hands that raise 45% of the time and call 55% of the time, and nobody plays that at the table. So what does it actually cost to round it off?
I pulled the solutions out of Poker Academy and measured it. Two different things get called simplifying, and only one of them is expensive.
- Collapsing a mix, meaning you play one action where the solver splits, costs under 0.001bb a hand.
- Carrying one chart into a spot it wasn’t built for costs 0.007 to 0.044bb a hand, up to 1.06bb on a single hand.
- Forcing one bet size on every flop costs up to 0.79bb a flop if you keep the wrong one.
Every number below is measured against an opponent who keeps playing the solver strategy, so all of them are lower bounds: someone who notices your simplification exploits it further than this. I’ll come back to that at the end.
The solver only mixes between actions it prices the same
Here is the spot I’ll use for the preflop half: NL200 fast fold cash, 100bb, 6-max, no ante. Everyone folds to the button, the button opens to 2.5bb, and the big blind has to decide.
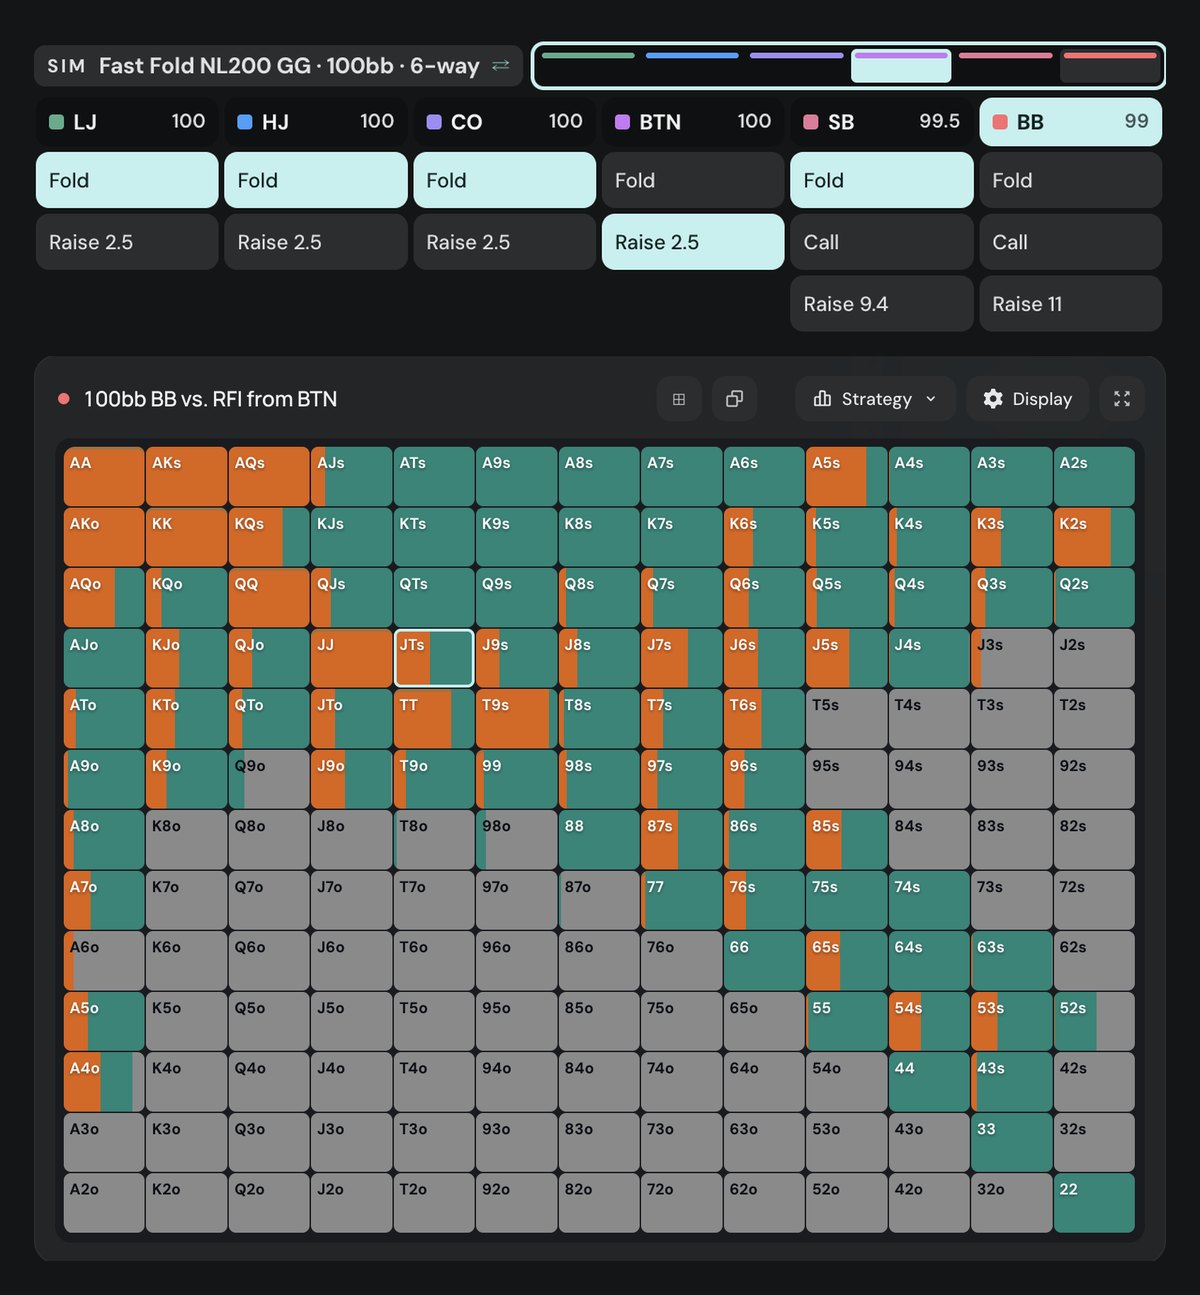
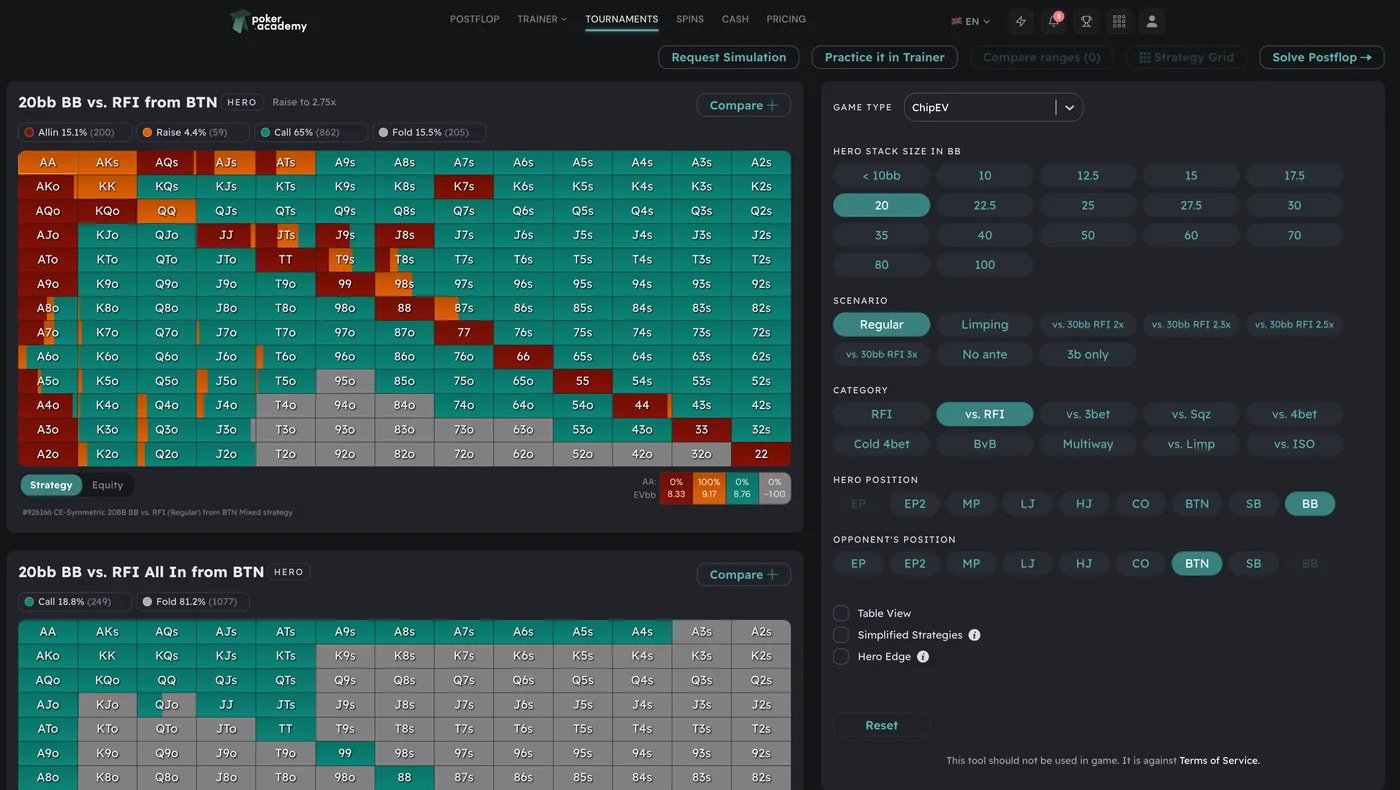
Over all 1,326 combos the big blind folds 59.5% (789 combos), calls 29.0% (384) and 3-bets to 11bb 11.5% (153). Look at the matrix and most of the interesting cells are split in two. JTs is one of them. Click it and the app shows all four combos:
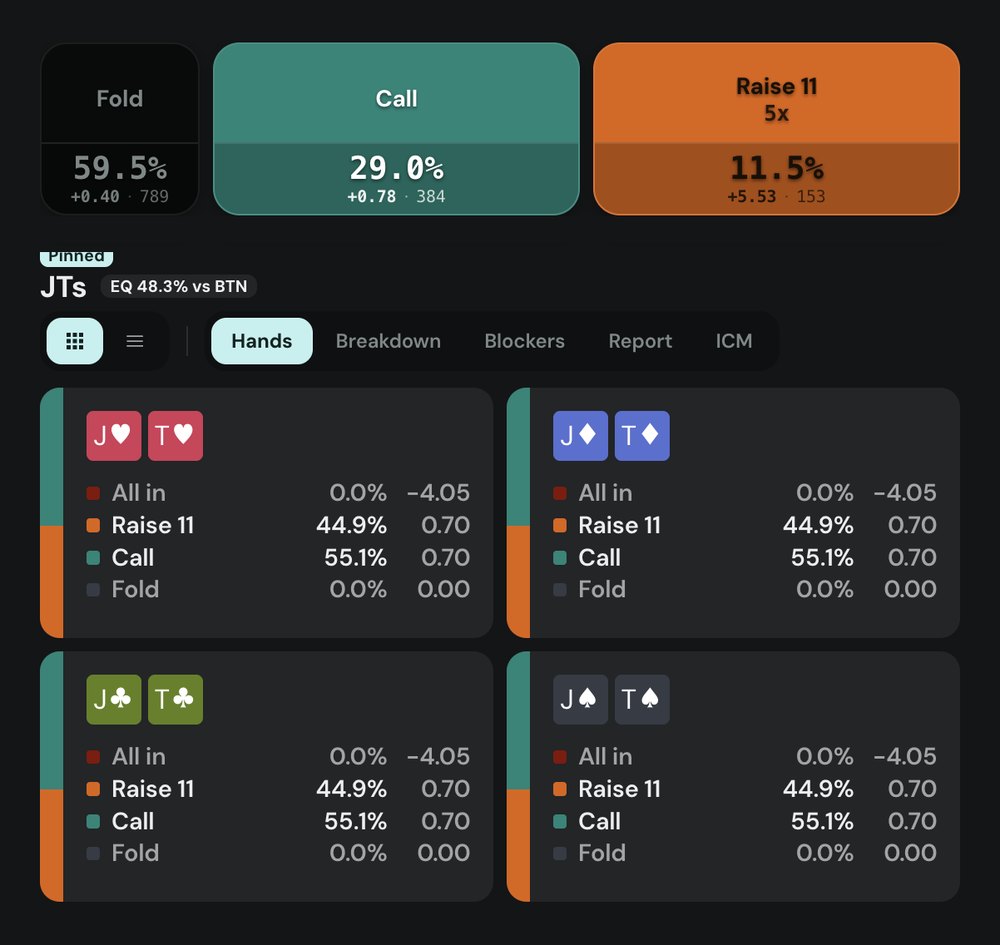
That is the whole answer. The 3-bet is worth +0.69781bb, the call +0.69862bb. They differ by 0.00081bb, less than a thousandth of a big blind.
That holds for every mixed hand, because it is what a mixed strategy is. The solver splits a hand between two actions only when it values them equally; if one were better it would take that one every time. The split exists to keep the opponent from reading your range, and the hand is worth the same either way.
What the mix is worth, per combo
Replace the mix with either of its actions and you keep 0.698bb. There was no gap to begin with, so there is nothing to lose.
Collapsing the mix: measured, and it really is free
Poker Academy has a switch for this. In Browse, under Display, turn on Simplify and the same node redraws with the splits collapsed.
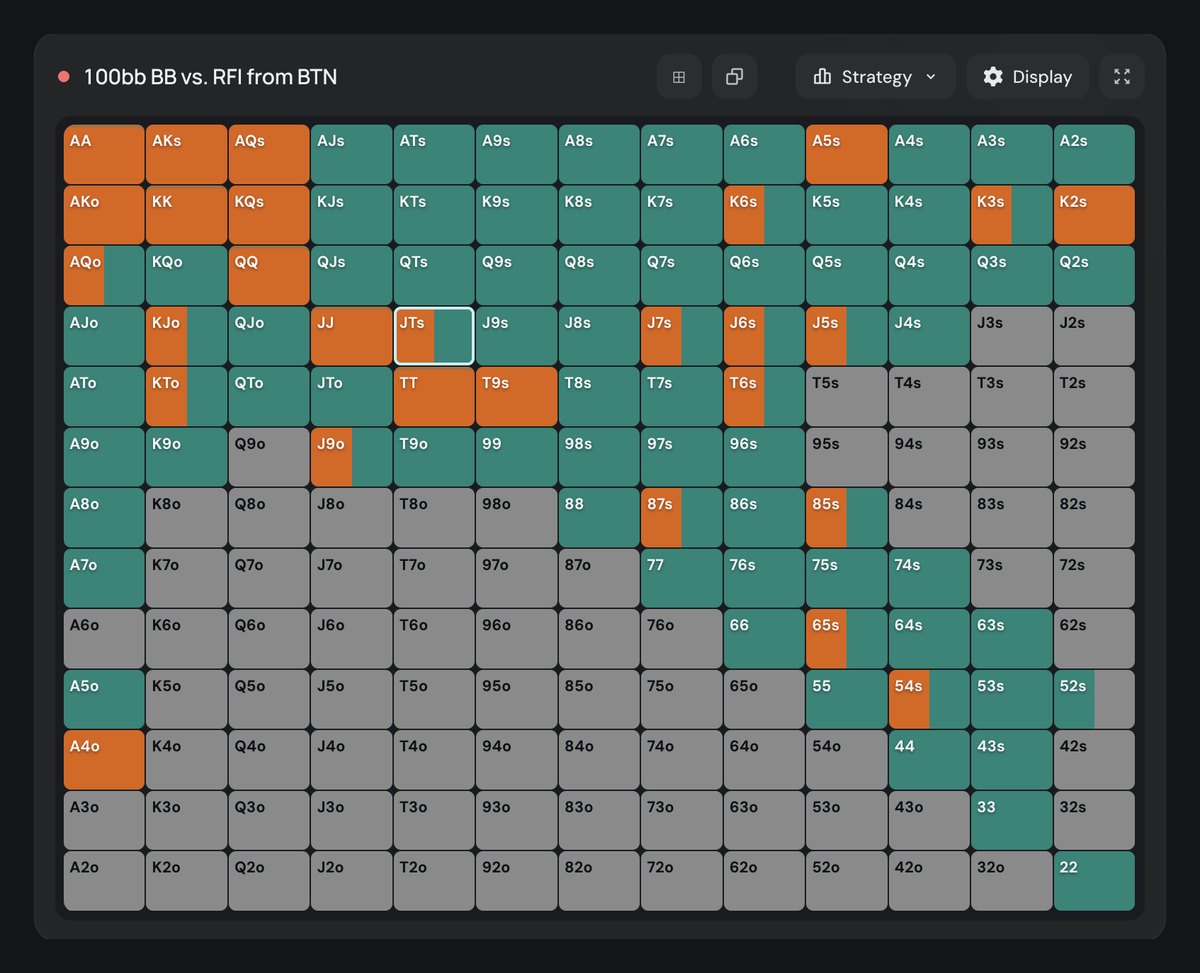
I ran the collapse over every hand in the node and weighted it by combos: 6 for a pair, 4 suited, 12 offsuit. Three spots from the same simulation:
- LJ opening, first in: 6.6% of combos are split. Range EV changes by less than 0.001bb a hand; the worst single hand loses 0.0003bb.
- BB against the button open above: 33.5% split. Under 0.001bb a hand, worst hand 0.0010bb.
- BB after a small blind limp, where the big blind can check or raise to 4bb: 80.1% split, four combos in five. Still under 0.001bb a hand, worst hand 0.0094bb.
One detail worth being honest about: in every one of those spots the collapsed chart scores a hair higher than the mix, by at most 0.0004bb a hand. That is the residual left in the solution, because the solver stopped at a small but non-zero distance from equilibrium. A simplification that beats the solver by a thousandth of a big blind is convergence noise.
An old claim from the previous version of this post, that the big blind plays 100% of hands after a small blind limp, holds exactly in the solution I pulled: fold is 0.0% of all 1,326 combos, raise 41.8%, check 58.2%.
What the Simplify button actually does
The old description of this feature, and the tooltip in the legacy tournament charts, says it “rounds mixed % actions: 0-33% → 0, 34-66% → 50%, 67-100% → 100%”, and that string is still in the app today. It is not the algorithm. I read the source (src/shared/strategy/simplify.ts, the single implementation both the legacy charts and Browse call). It is a pattern match over the whole four-action distribution, not per-action rounding:
- Exactly two actions each above 34%, with the other two each below 10% → those two split 50/50.
- Otherwise the strictly largest action takes 100% and the rest go to zero.
- If neither fits (an exact tie, or a three-way mix like 35/35/30) the strategy is left unchanged.
- Frequencies are rounded to two decimals before any of that, and the comparisons are strict.
Most of the time the two descriptions agree. Across every named node of three simulations, 1,498,760 combo-instances, they differ on 0.55% of them. On those hands the difference matters. 66 opening from LJ in this cash game raises 65.7% and folds 34.3%. Round each action on its own and you get “open half the time”. The app shows a pure open, because 34.3% rounds to 0.34 and the 50/50 rule needs strictly more than that.
Play this spot instead of reading about it
Start Free TrialThe trainer deals the situations this article describes and grades every decision you make. Try it free for 3 days.
I’d rather have the pure open: “open 66 from LJ” is a rule you can follow, while “open it two times in three” is a rule you will misapply. Either way it is worth knowing which one the button gives you.
The expensive simplification: one chart, more spots
Now the part that costs money. What people actually simplify is the number of charts they carry: one big blind defence chart, used against everybody.
So I took the simplified big blind chart built against a button open and used it against an LJ open, with the same simulation, the same 100bb stack and the same menu of call, 3-bet or fold. Then I priced every hand with the EV table of the spot it is actually being played in.
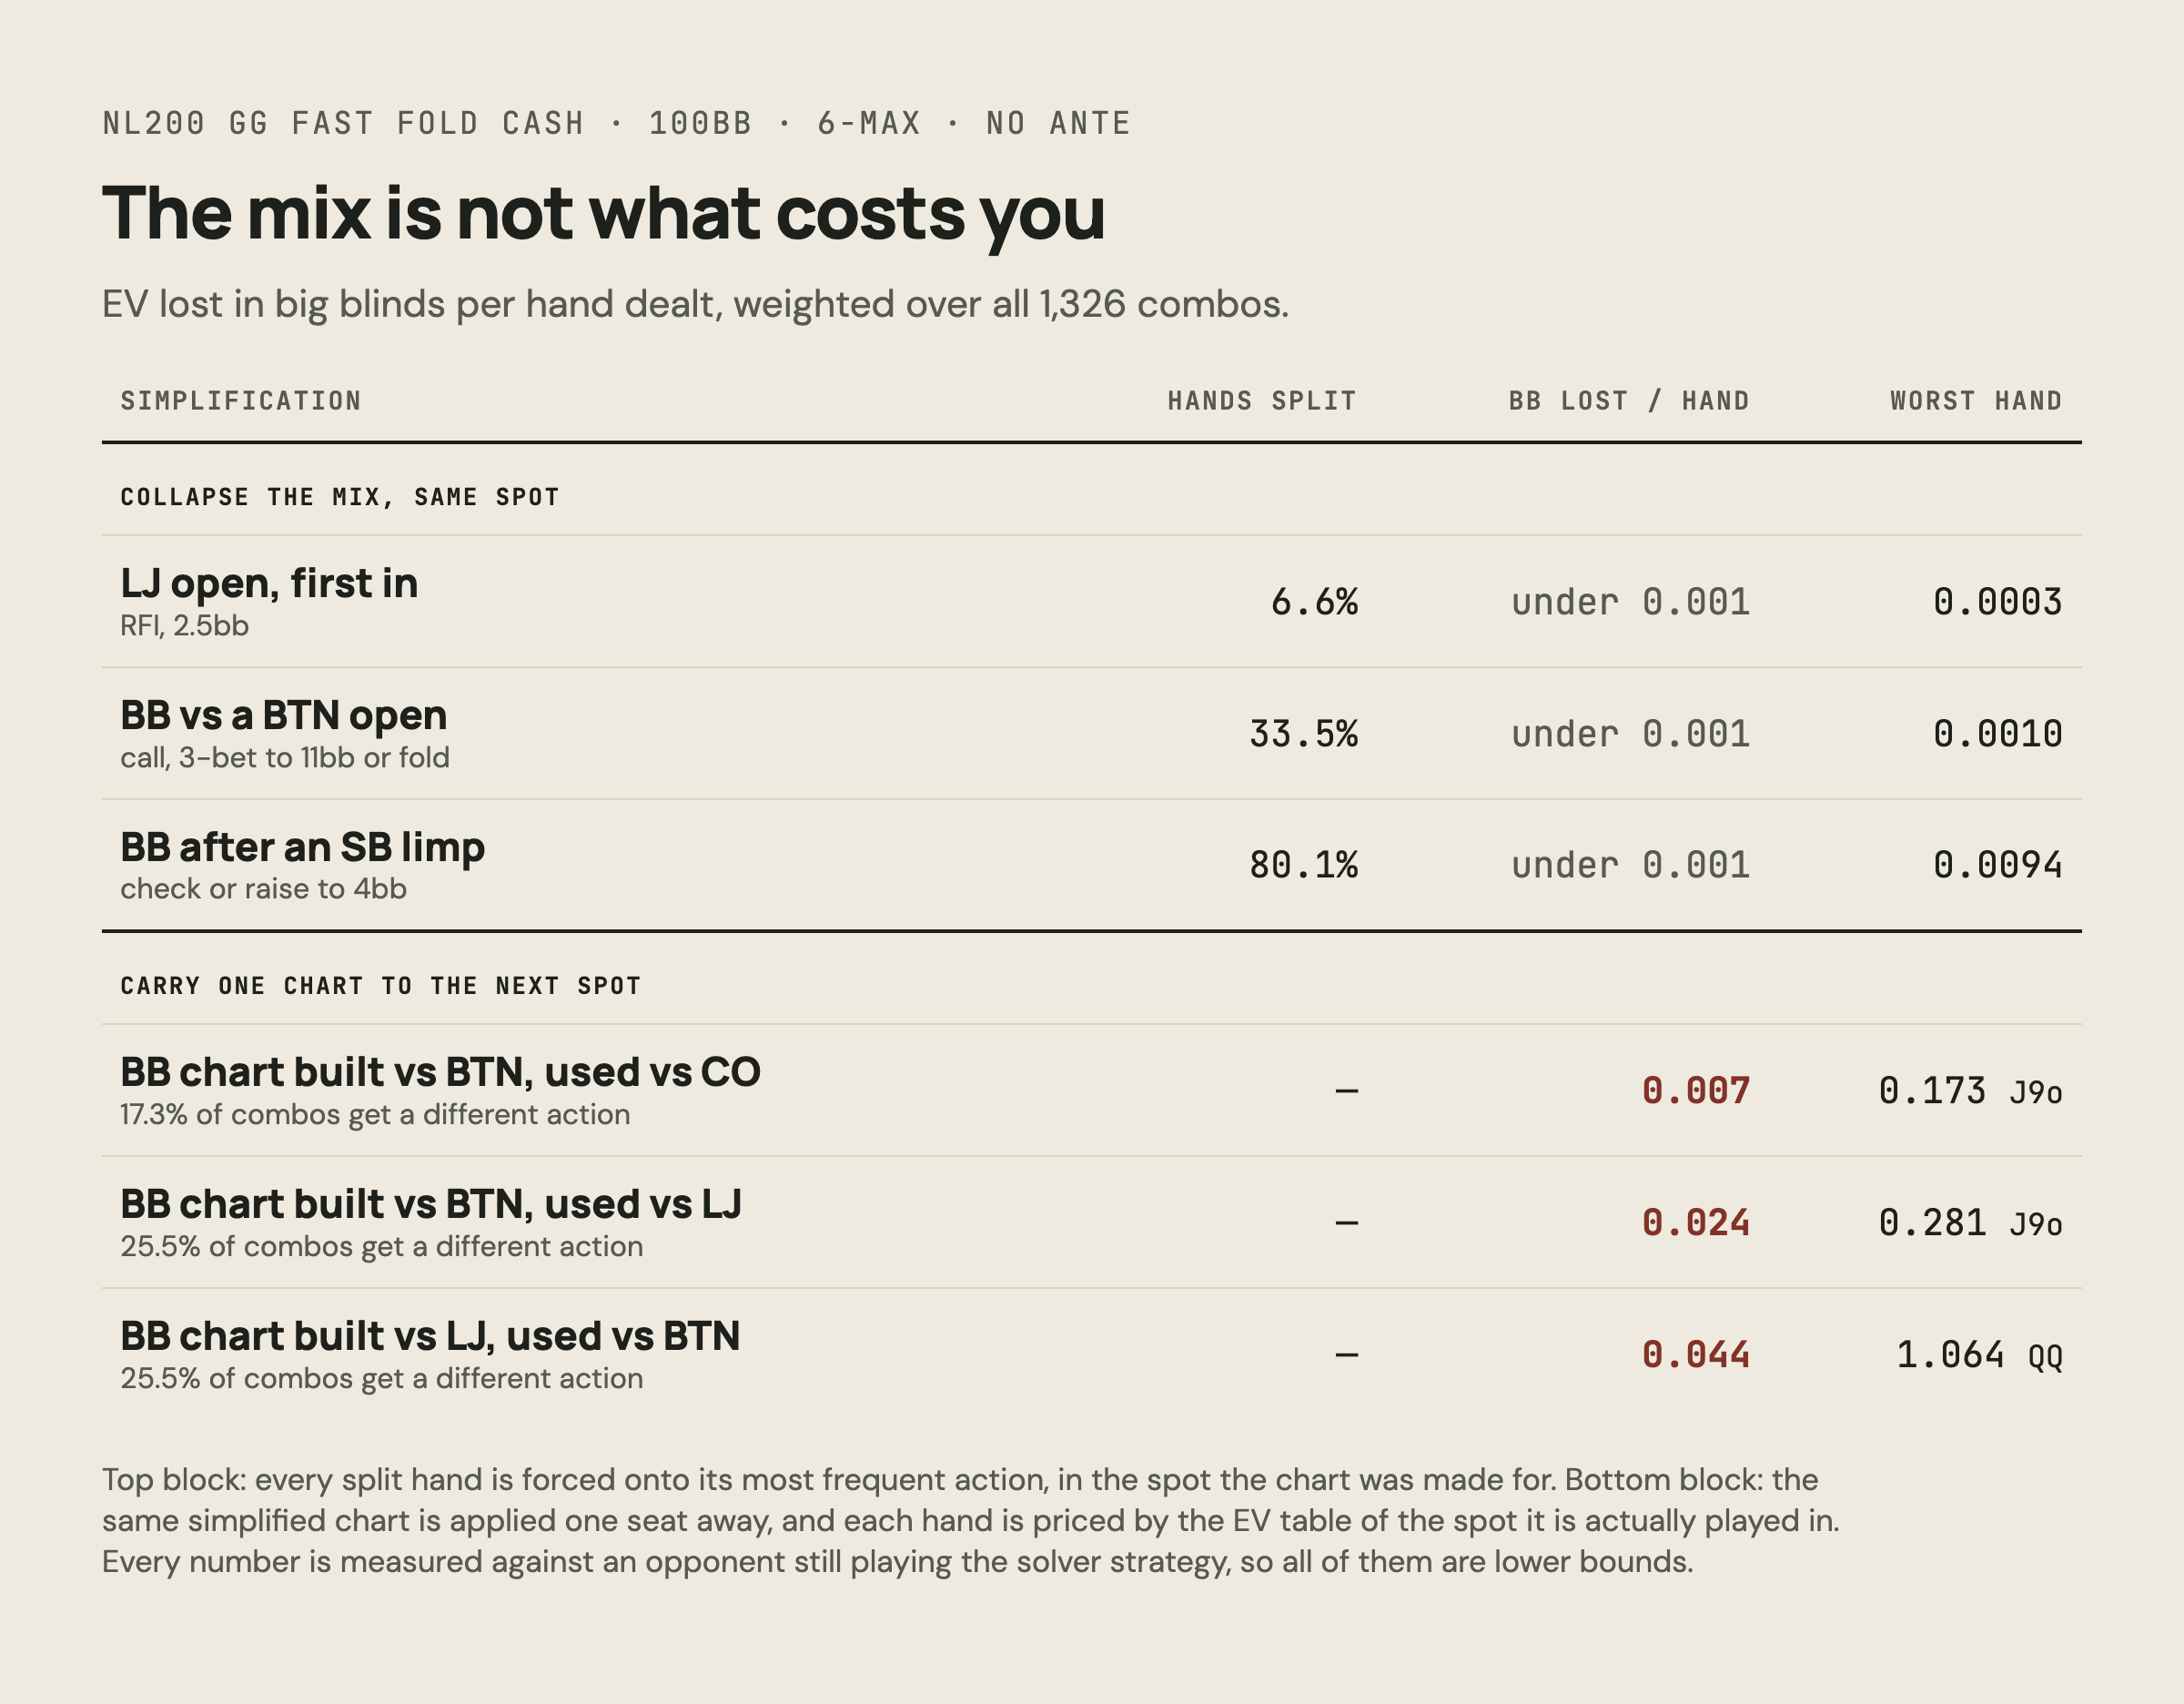
25.5% of combos get a different action from the two charts, and it costs 0.024bb a hand in that direction, 0.044bb in the other. Two hands show where it comes from:
- J9o: the button chart 3-bets it. Against an LJ open the solver folds it 100%, and 3-betting is worth −0.281bb against 0.00 for folding.
- QQ: the LJ chart calls it, because against an early open the solver calls QQ 69.1% of the time. Against a button open, 3-betting is worth +4.742bb and calling +3.678bb. Flatting costs 1.064bb, every time you do it.
One more measurement settles it. Carrying the unsimplified chart, with the full 25/75 mixes, into the wrong spot costs 0.0243bb a hand instead of 0.0236bb, and rounding the mix off changes the bill by 0.0007bb in favour of the simplified chart. What costs money is the wrong spot, not the mix.
That also tells you what to simplify first. Collapsing mixes buys a memorisable chart for free; using one chart in five spots buys 25% wrong actions.
Postflop: one size on every board
The spot: MTT, 20bb, 9-handed, 1bb big-blind ante. The button opens to 2bb, the big blind calls. Pot 5.5bb (2 + 2 + 0.5 + 1), 18bb effective. The big blind is out of position, so it acts first on the flop.
The old post said the solver “advises some raising” here about 2.3% of the time. It can’t. The big blind is first to act and nobody has bet, so there is nothing to raise. The action is a lead, or donk bet, and the frequency for it is small but real. On K♣︎K♦︎4♥︎ the big blind checks 92.3% of the time, and leads 7.7%: 5.3% at 19% pot, 2.1% at 29% pot, 0.2% at 60% and 0.1% at 120%. Across the whole weighted flop set it checks 95.7%.
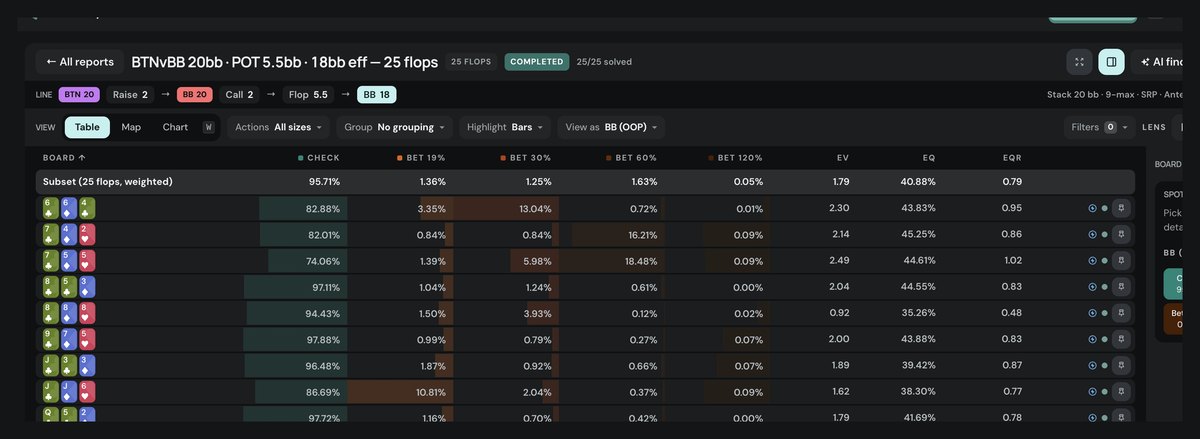
Now the cost question. Every one of these reports has a Simplify drawer that asks exactly what this article asks: force one action on every board, and see what it costs against the solver’s mix.
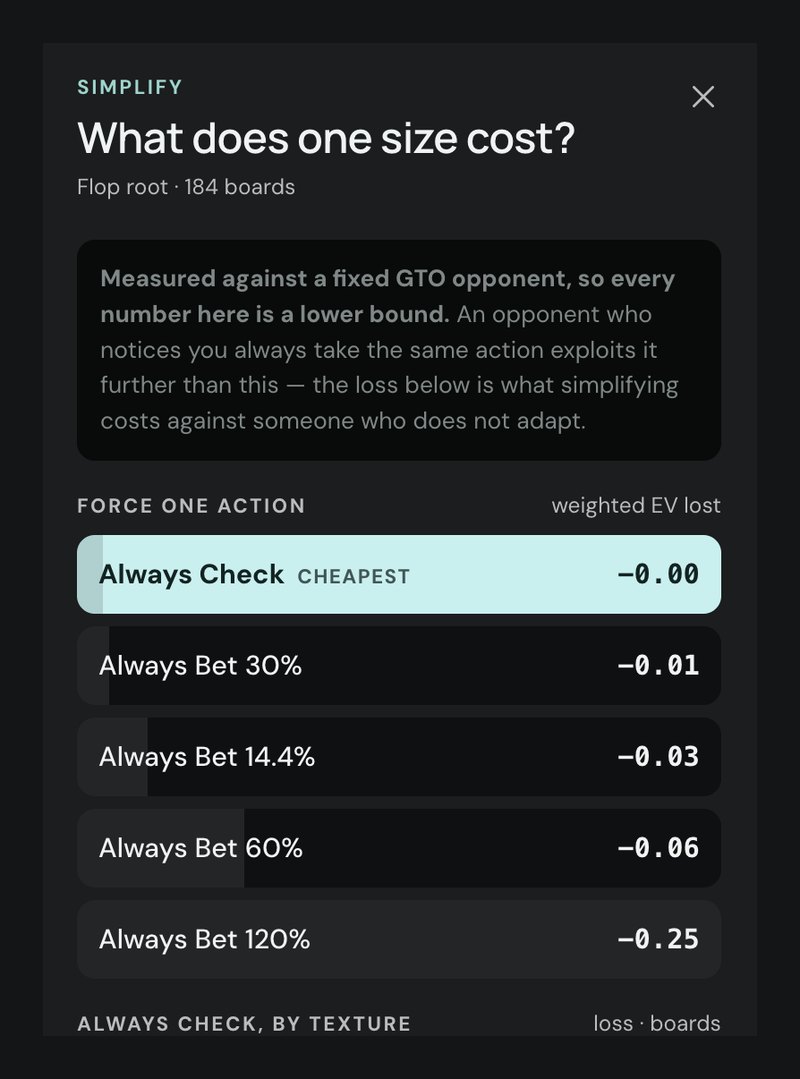
Read the caveat at the top of that drawer, because it applies to every number in this article: the loss is measured against an opponent who does not adapt, so it is a floor on the real price.
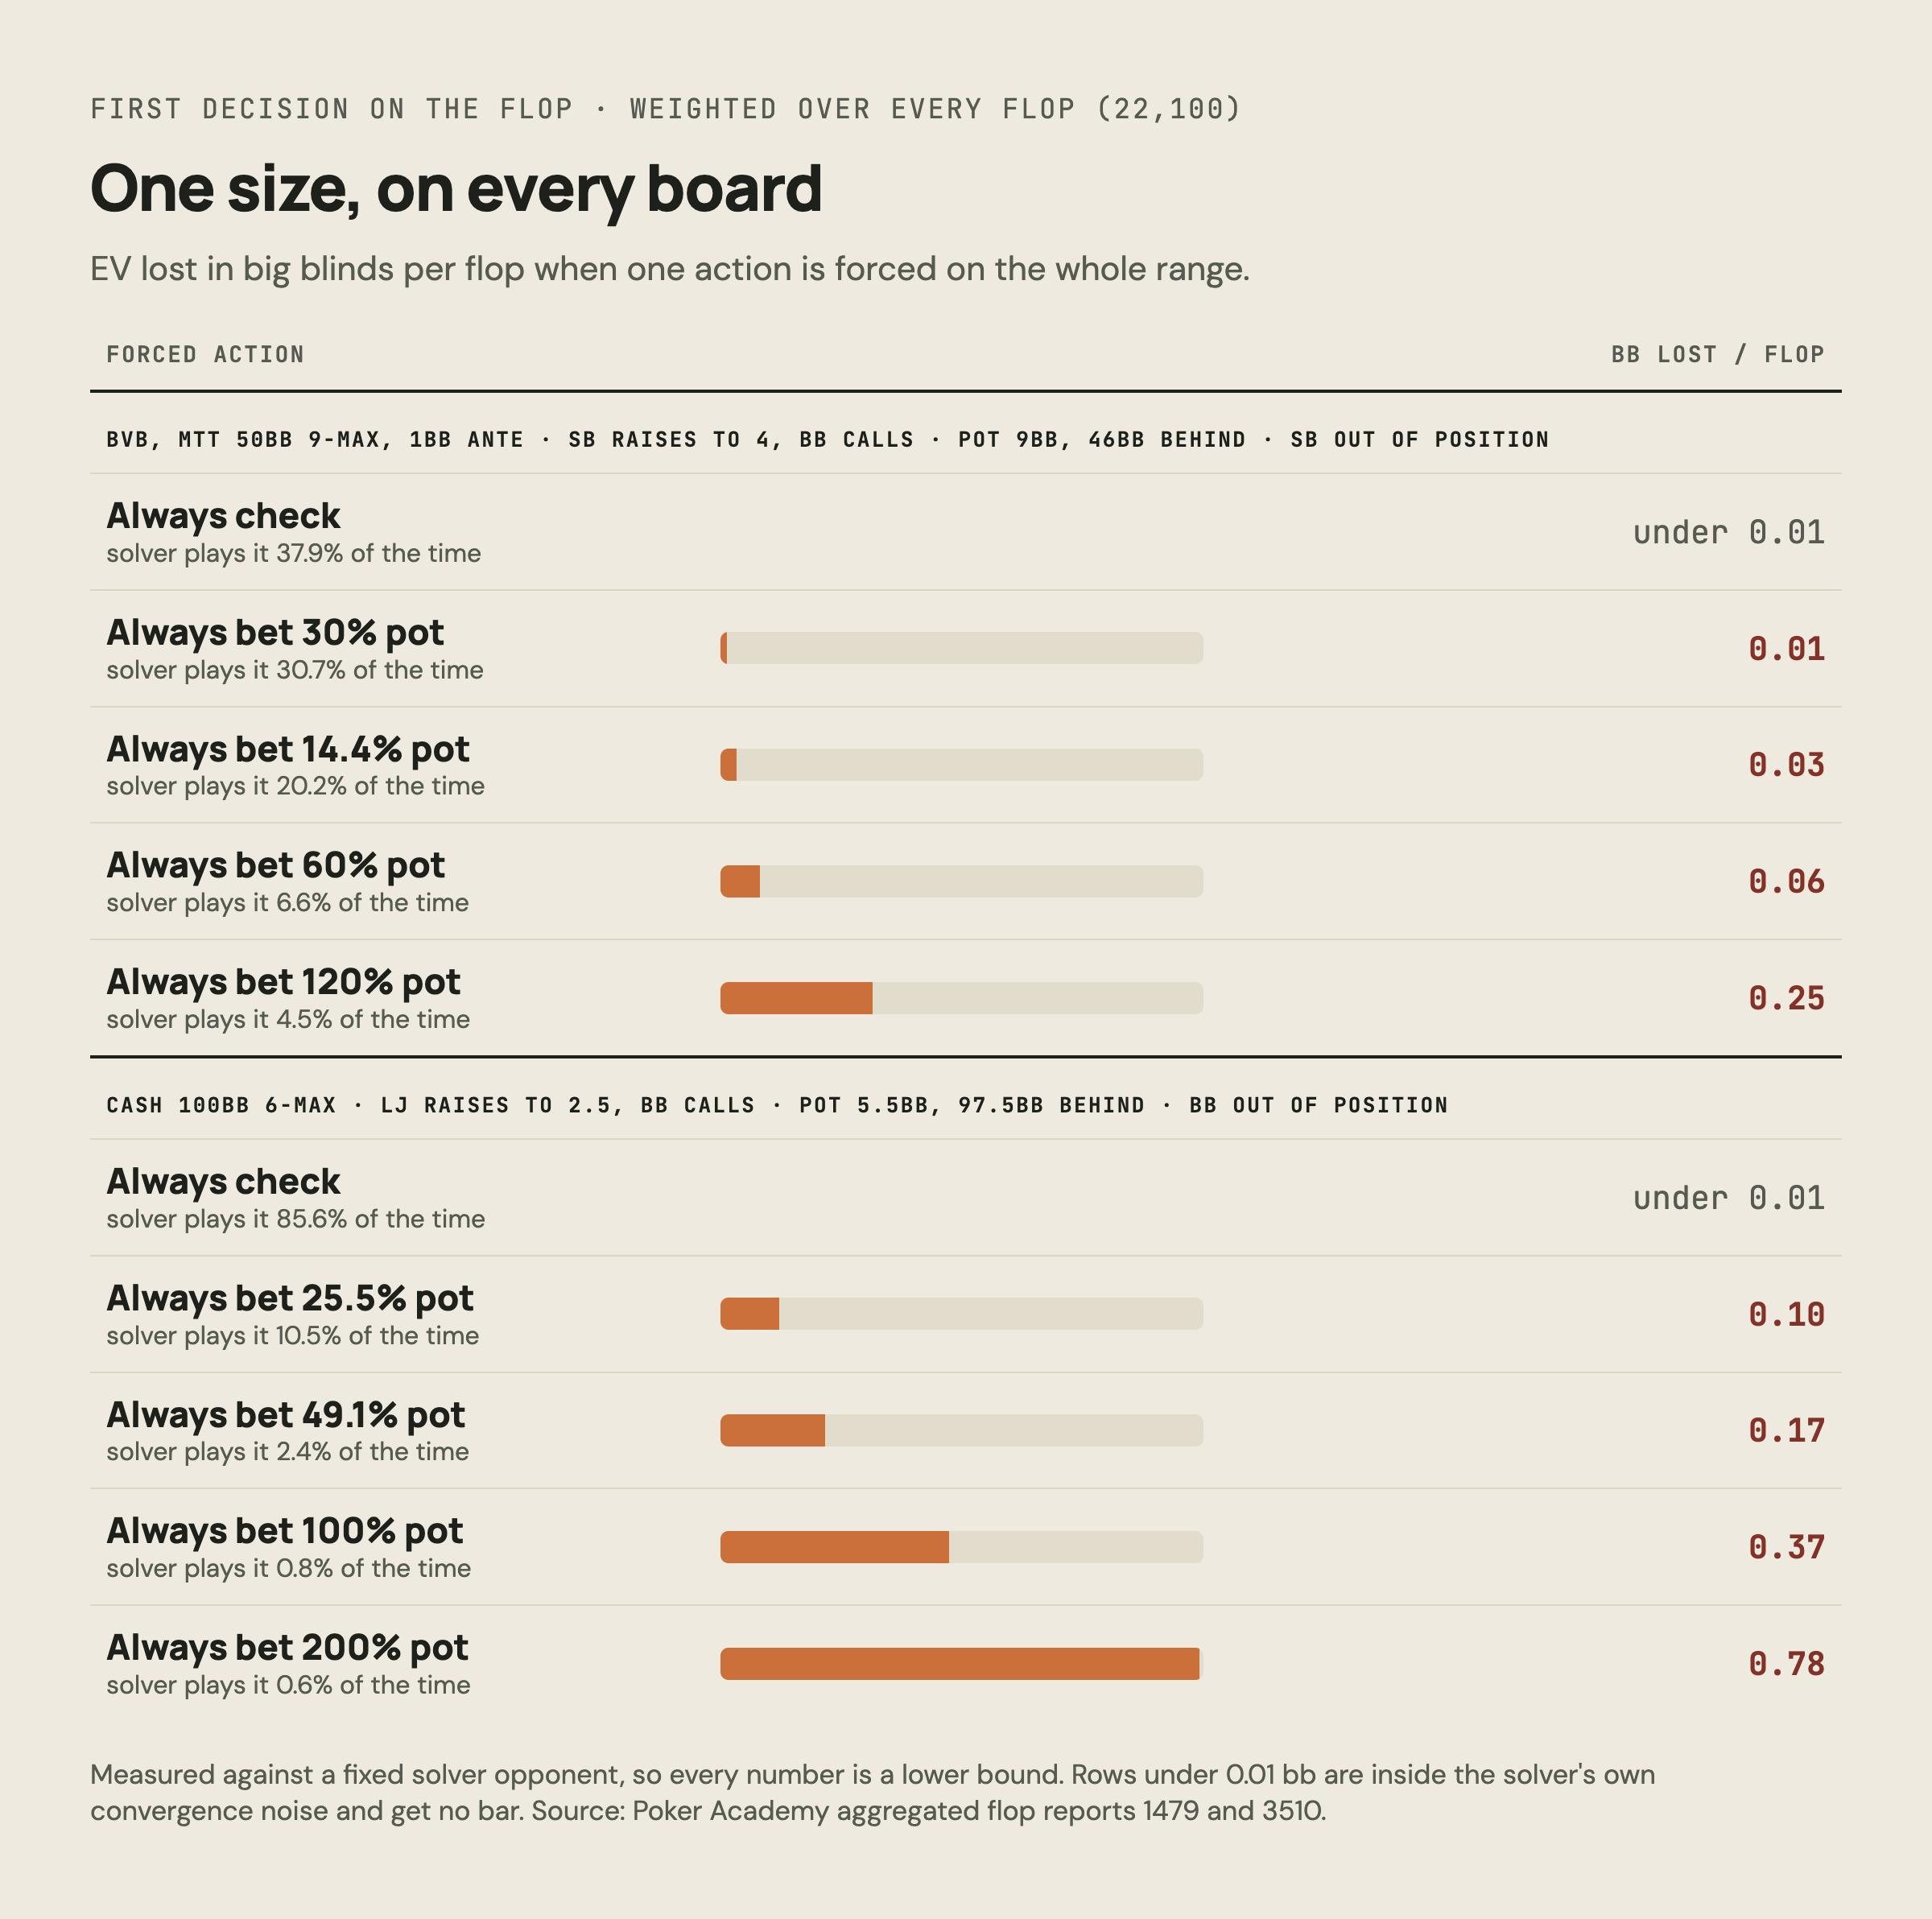
The pattern is the same as preflop, one level up. Picking a single size is nearly free if you pick one the solver uses a lot and expensive if you don’t:
- Blind vs blind, 50bb: always check costs under 0.01bb a flop, always bet 30% pot 0.01, always 14.4% pot 0.03, always 60% pot 0.06 and always 120% pot 0.25bb.
- 100bb cash, big blind against an LJ open: always check is again under 0.01bb, always bet 25.5% pot costs 0.10, and always overbetting 200% pot costs 0.78bb a flop.
Notice which action is cheapest in both spots. Out of position, checking the whole range sits inside the solver’s own noise: the leads are worth so little that giving them up costs nothing measurable against a fixed opponent. They exist to make the other player’s life harder, and that is what a fixed-opponent measurement cannot see.
Where simplification really costs you
Everything above is measured against a solver opponent. That is the honest way to report it and it is also its limit. Three costs the numbers cannot show:
- Your opponent adapts. If you always check the flop out of position, a decent player bets more and folds less, and the 0.00bb in the drawer becomes a real number as soon as anyone notices.
- The simplification travels. A range you always check has a different composition on the turn than a range you sometimes lead, and the flop number does not carry the turn cost.
- You apply it too widely. This is the one the data does show, and the expensive one: 0.044bb a hand for one seat’s worth of wrong chart.
A few rules of thumb, which are my reading of the numbers above and not solver output:
- Collapse every mix you like. It is free within a spot, and a chart you can recall beats a chart you half-remember.
- Never reuse a chart across openers, stack depths or ante formats. That is where the measurable money goes.
- If you must keep one bet size, keep the one the solver plays most, and never the biggest one. In these two spots the biggest size costs 8 to 22 times what the smallest one does.
- Keep mixing where it is cheap to mix, if you can: the frequencies are what stop a thinking opponent from reading you.
Is simplifying the road to success? Simplifying how you remember the strategy: yes, and it is cheaper than almost anyone assumes. Simplifying how many situations you cover: that one is a leak wearing a friendly name.
Cheers! 🙂
Keep reading
All posts
Poker Academy
Stop guessing preflop.
1,500,000+ GTO preflop solutions. Try them free for 3 days.
Start Free TrialCancel anytime.