
Poker HUD stats explained: VPIP, PFR, 3-bet, and how many hands you need to trust them
 Filip PedzichUpdated· first published ~9 min read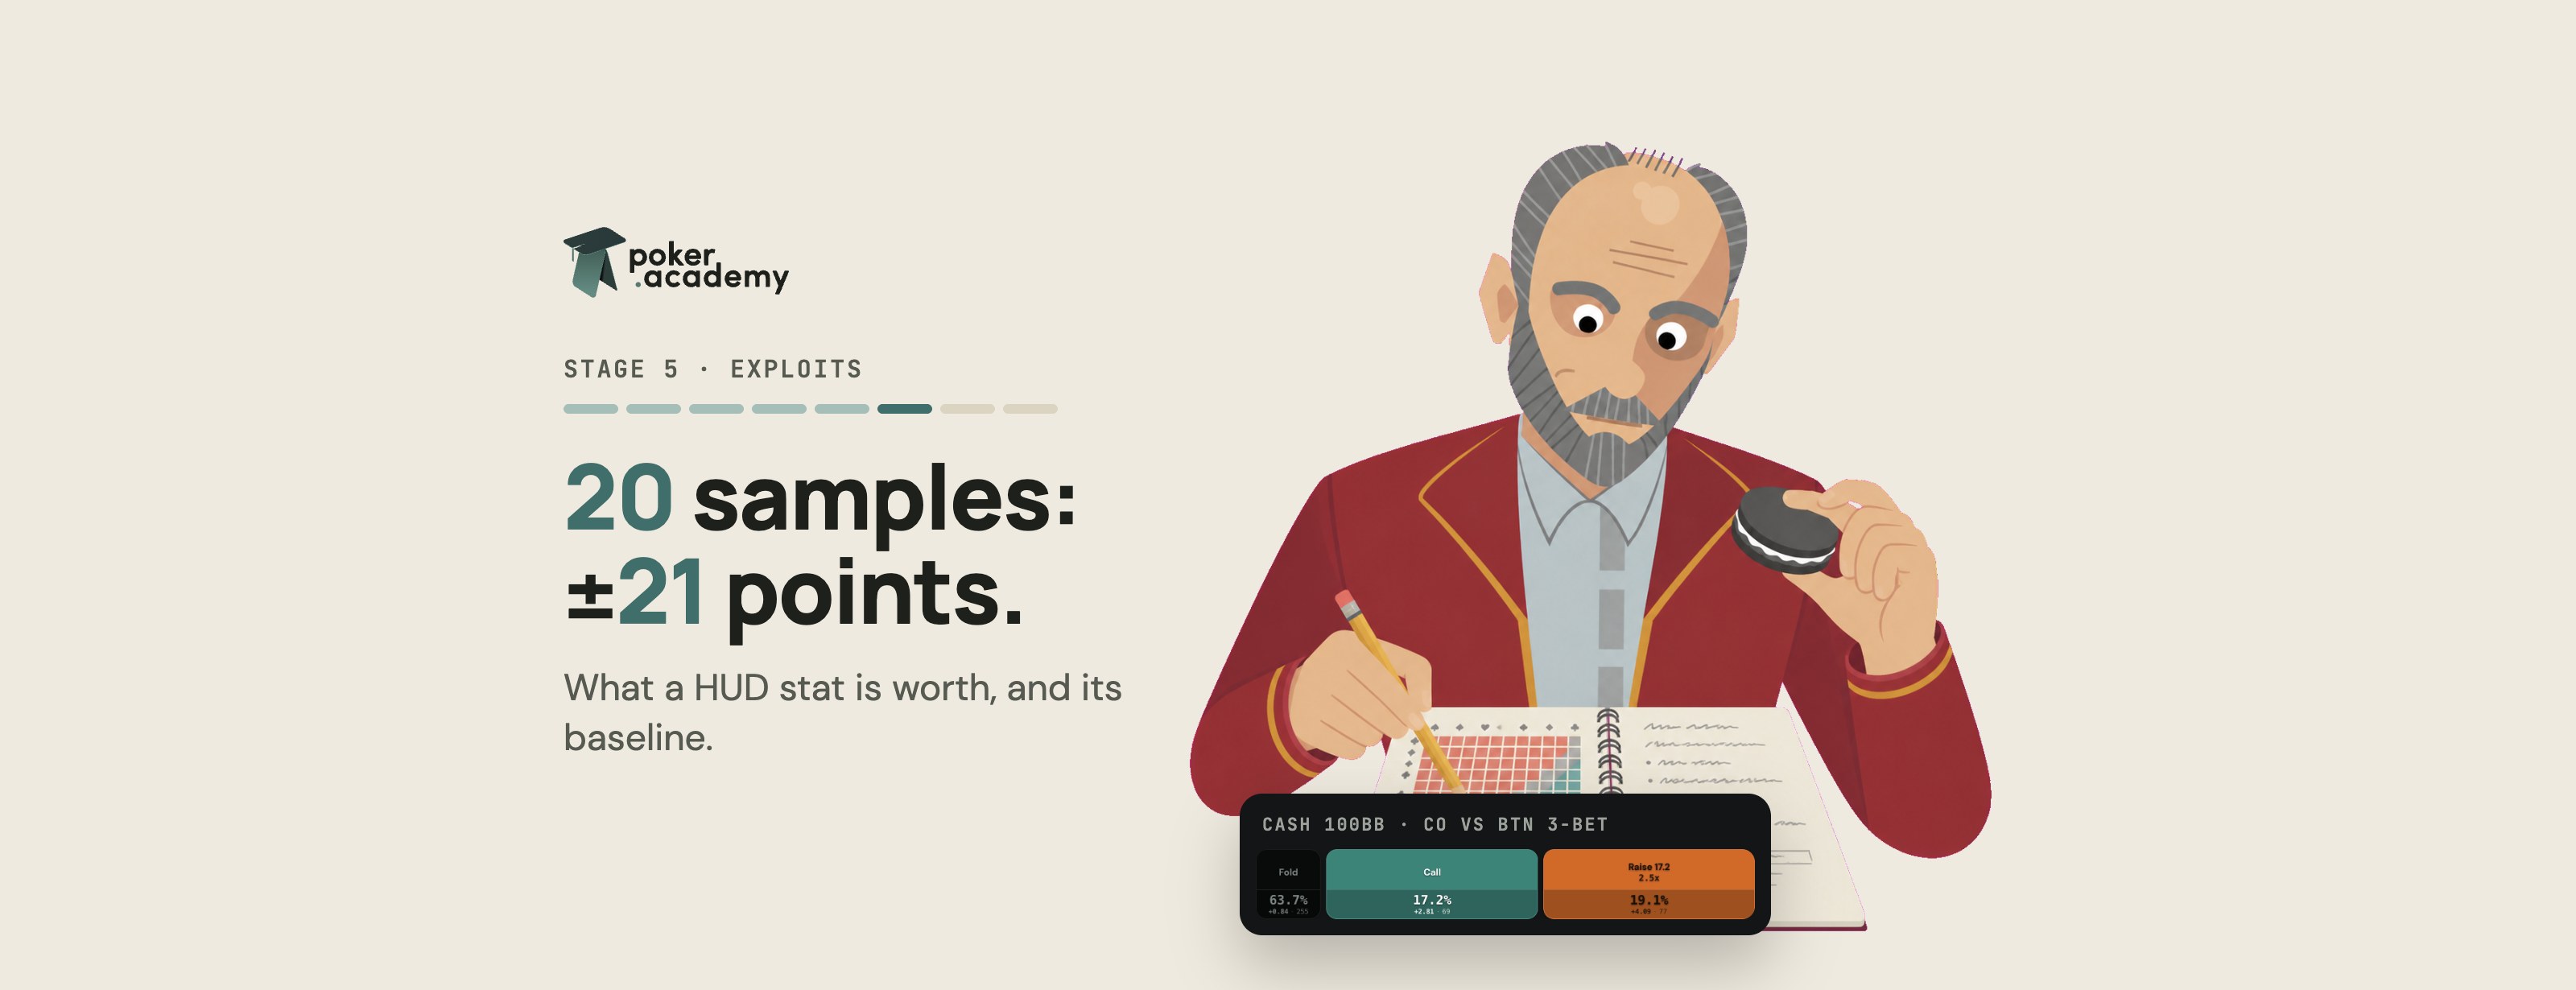
A HUD (heads-up display) is a small box of numbers next to each opponent at an online table. A tracking program reads your hand histories, counts what every player did, and shows the percentages while you play. All it reports is how often somebody did something, in the hands you happened to see.
That last part is where most HUD advice goes wrong. A number is only worth something if you know two more things: what the number should be for a player who plays well in that spot, and how many hands it rests on. Below I go through the common stats, give solver baselines for the preflop ones from a real simulation, and work through the maths of sample size, so you can tell a read from noise.
First: check the site’s rules
Not every site lets you run a HUD. GGPoker, for example, doesn’t allow third-party tracking software and shows its own built-in player stats instead. Other sites allow trackers but ban specific tools, and tables with anonymous players make a HUD useless because you can’t follow one person. Real-time assistance, meaning anything that tells you what to play during a hand (a solver, a chart lookup, a coach), is banned on every major site I know of. The rules change, so read your site’s list of permitted software before you install anything. Poker Academy is a study tool for between sessions. Keep it closed while you play.
The preflop stats
Preflop stats fill up fastest, because every hand you’re dealt is a preflop hand. These are the ones worth having:
- VPIP (voluntarily put money in pot): how often a player calls or raises preflop. Posting a blind doesn’t count; checking the big blind doesn’t count.
- PFR (preflop raise): how often he raises preflop. PFR is always less than or equal to VPIP. The gap between them is the hands he only calls or limps.
- RFI by position (raise first in): how often he opens when it’s folded to him, split by seat. This is PFR broken into the spots that actually differ, and it’s the one you can compare with a solver.
- 3-bet: how often he re-raises when he faces an open.
- Fold to 3-bet: how often he folds after opening and getting re-raised.
Every one of these is a count of actions divided by a count of opportunities. VPIP gets an opportunity almost every hand. Fold to 3-bet only gets one when he opens and somebody 3-bets him, which is a small share of hands. That difference comes back in the sample-size part.
The postflop stats
- C-bet: how often the preflop raiser bets the flop when checked to (or when first to act).
- Fold to c-bet: how often a player folds to that bet.
- WTSD (went to showdown): of the hands where he saw the flop, how often he reached showdown. W$SD is how often he won when he got there.
I don’t give solver baselines for these. A c-bet frequency depends on the board, on who is in position, on the bet sizes and on the preflop line, so there is no single right number to hold a HUD stat against. To check a postflop tendency, solve the spot where you saw it. As a heuristic, a high WTSD together with a low fold to c-bet describes a player who doesn’t let go of hands; the calling stations article covers what to do against him.
Solver baselines: how often each seat opens
For the preflop numbers I use one simulation from the Poker Academy preflop charts: Normal NL200 GG, 6-max cash, 100bb, no ante, 2.5bb opens. These are the solver’s strategies for a table where everyone plays well. They are not averages of real players, and I don’t have population data to give you.
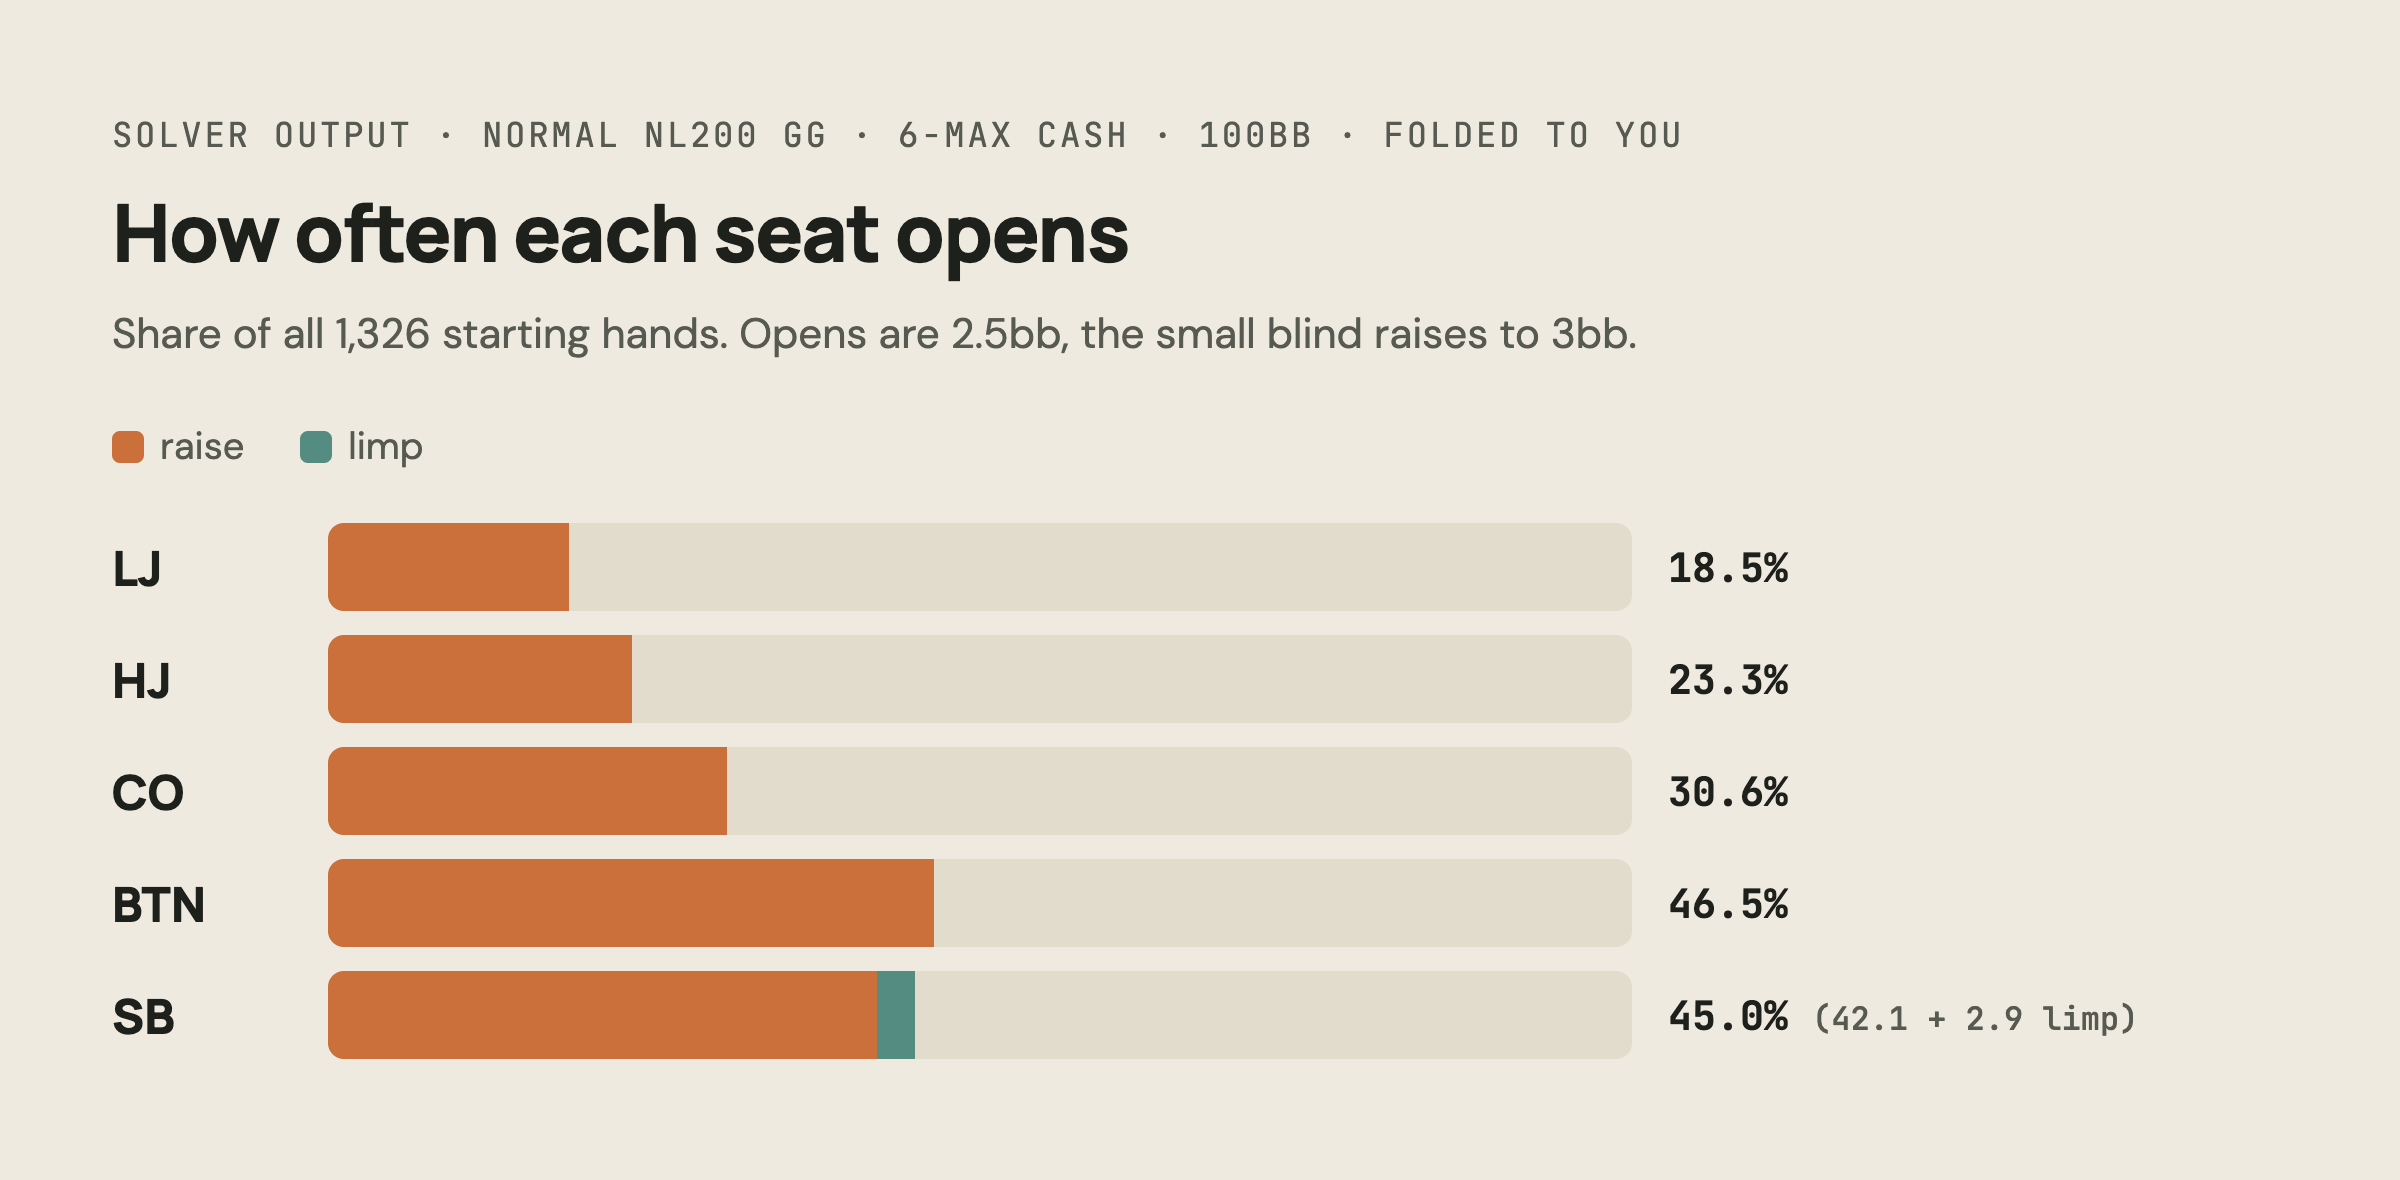
A player who opens 30% from every seat is too loose in the lojack and too tight on the button at the same time. His overall PFR can look perfectly normal and hide both leaks. That’s why I compare opens position by position, which PokerTracker 4, Holdem Manager 3 and Hand2Note all let you do.
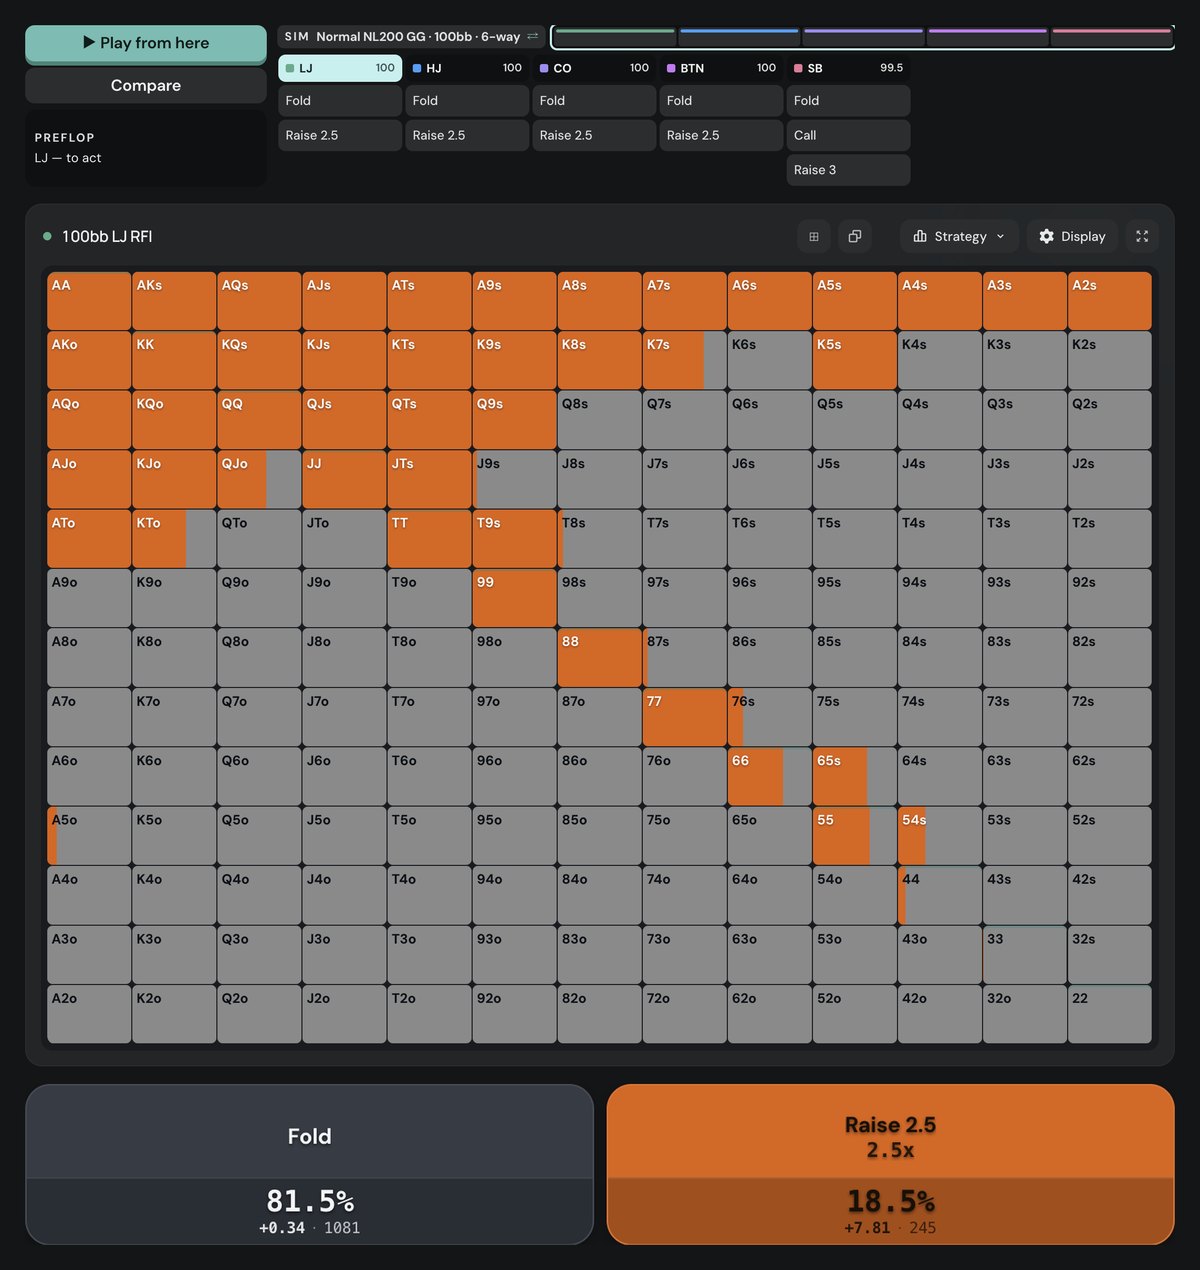
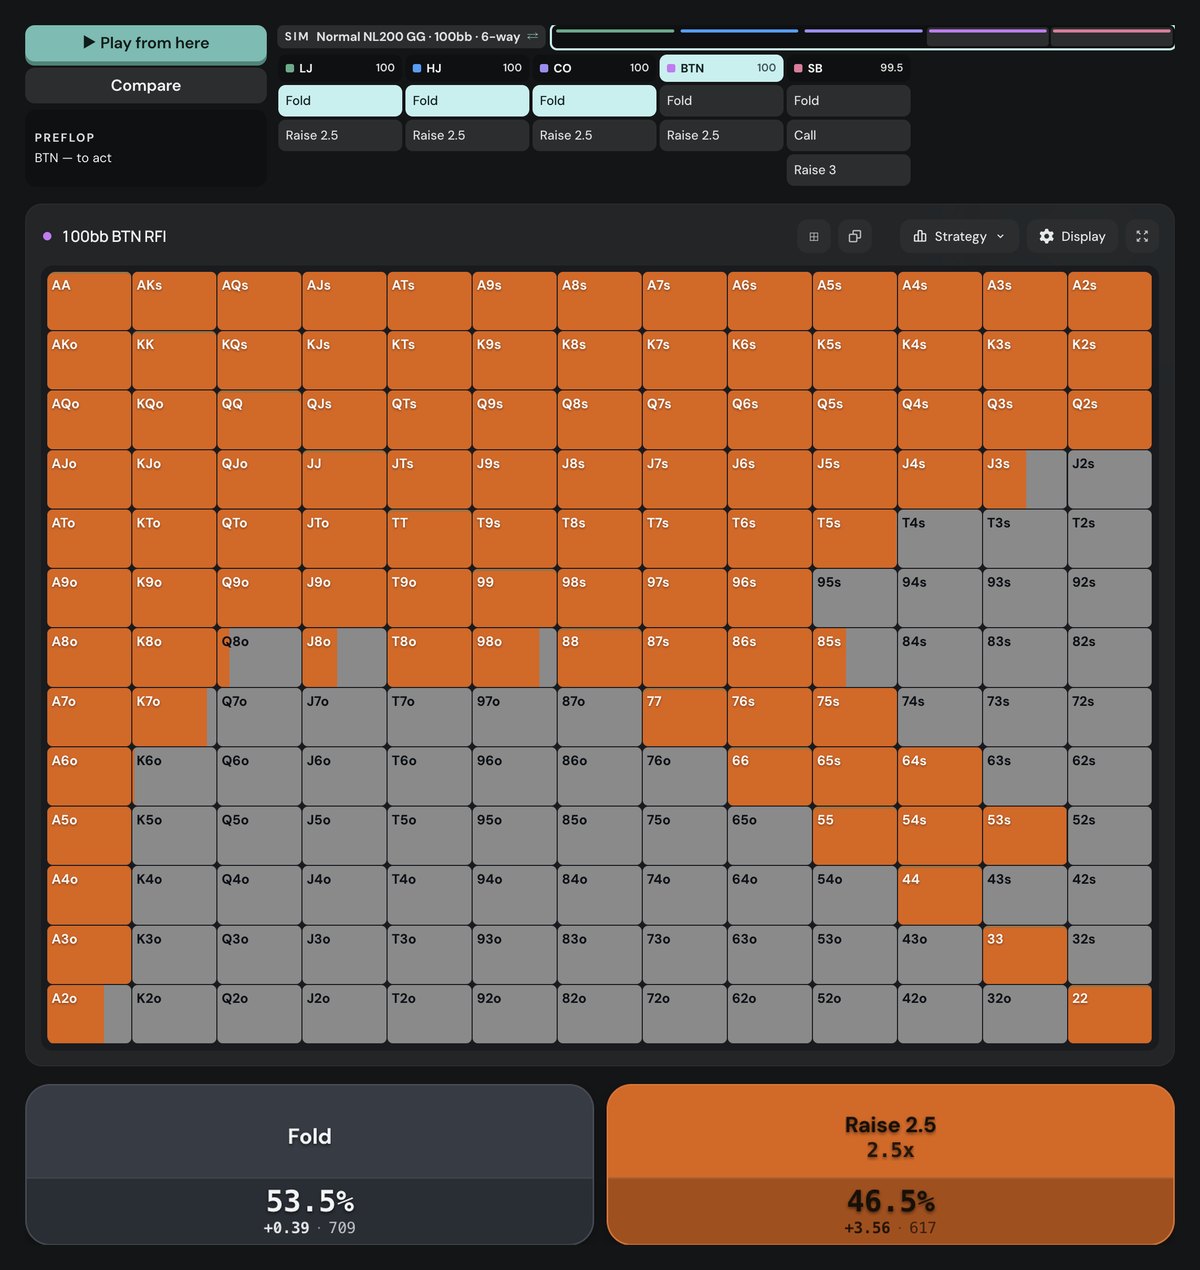
The old version of this article called 15 to 20% VPIP “average” without saying for which game. Here the lojack alone opens 18.5% of hands in a 6-max cash game, and the button 46.5%. The right number depends on the seat, the table size and the format, so one threshold for all of them doesn’t mean much.
Play this spot instead of reading about it
Start Free TrialThe trainer deals the situations this article describes and grades every decision you make. Try it free for 3 days.
Solver baselines: defending and 3-betting
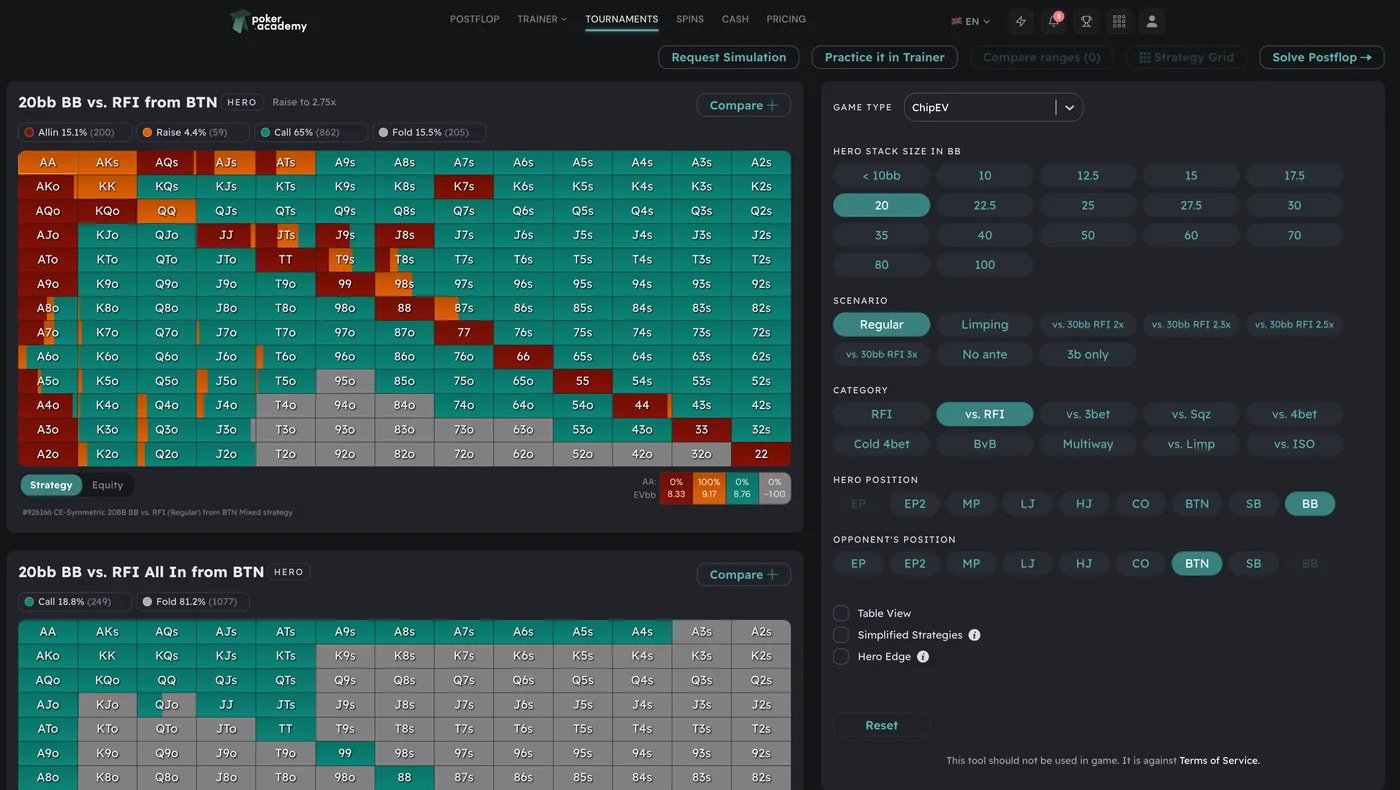
Against an open, the numbers move even more with position. In the same simulation:
- BB vs a BTN open: calls 29.0%, 3-bets to 11bb 11.5%, folds 59.5%.
- BB vs a CO open: calls 21.7%, 3-bets 8.1%, folds 70.2%.
- BB vs a LJ open: calls 16.4%, 3-bets 4.5%, folds 79.1%.
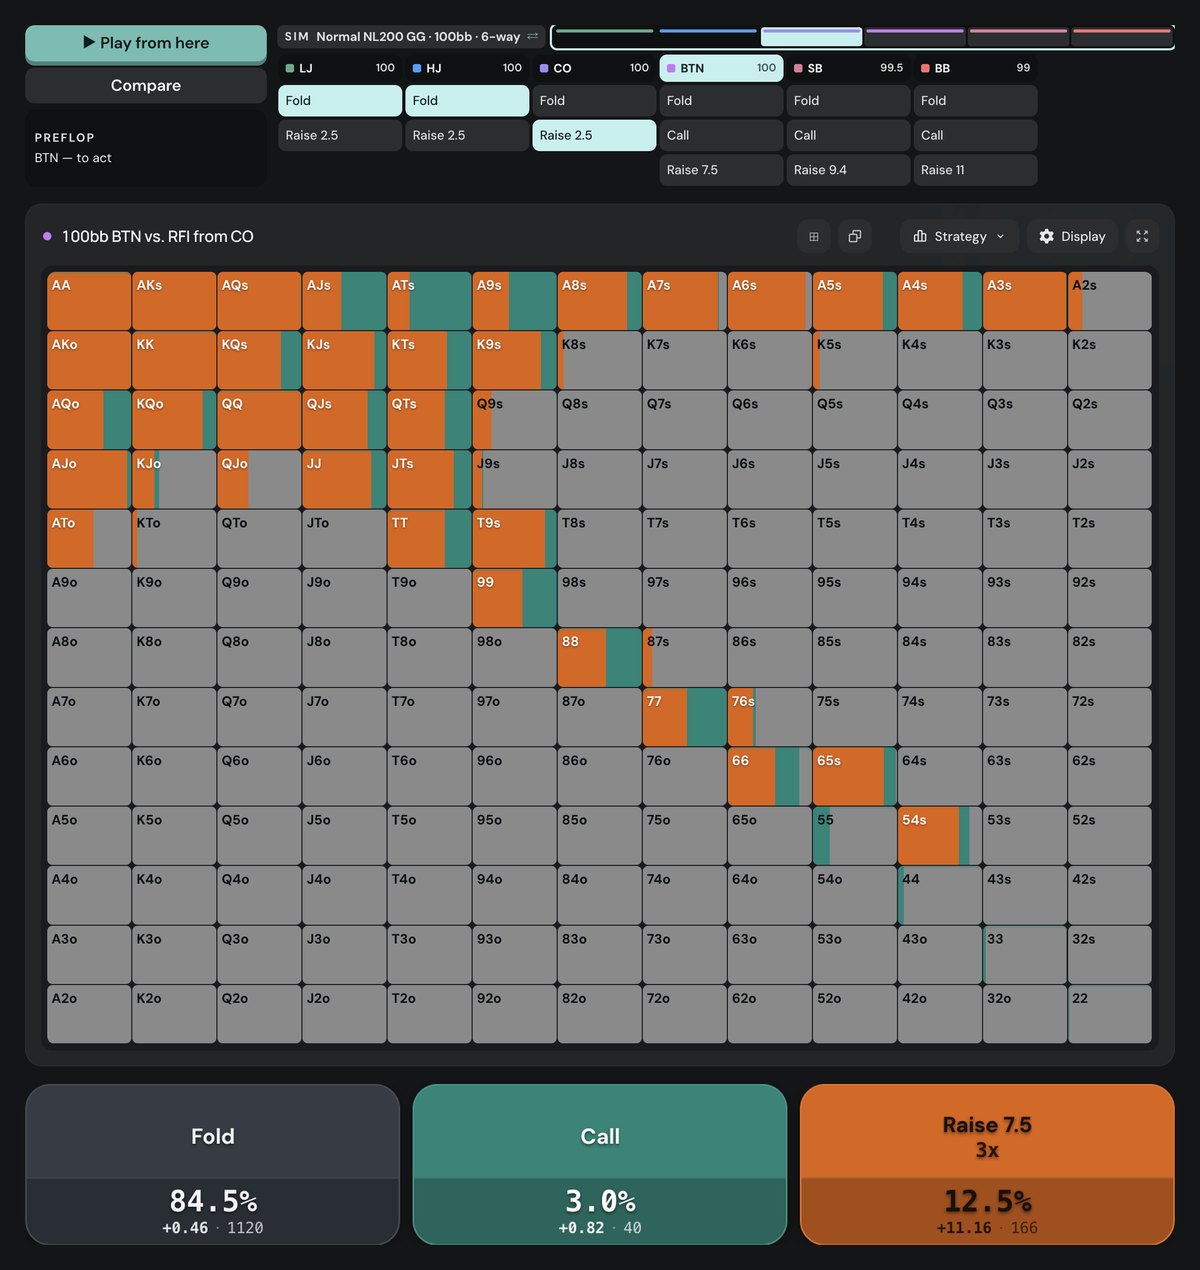
- BTN vs a CO open: 3-bets to 7.5bb 12.5%, calls only 3.0%, folds 84.5%.
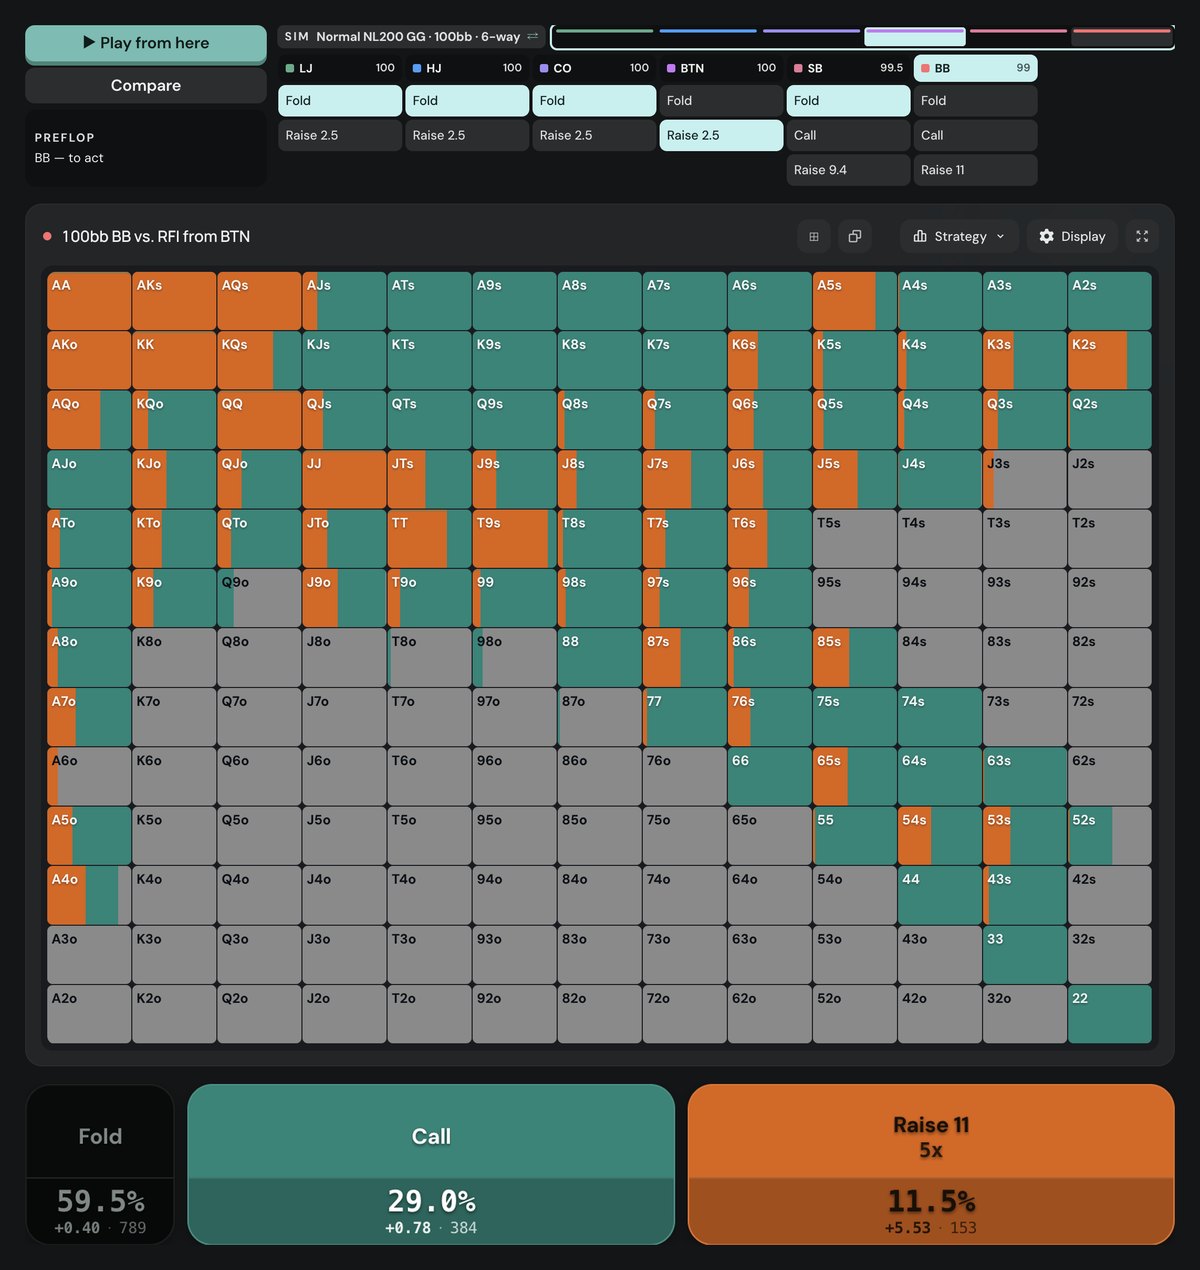
So a 3-bet of 4.5% isn’t automatically a nit. From the big blind against a lojack open it is exactly what the solver does. The same 4.5% against button opens would be far too tight. If your tracker shows one 3-bet number for all spots, it mixes these together.
The old article also said GTO “favours a polarized 3-bet range”. It depends on the spot. On the button against a CO open the solver almost never flats, so nearly every hand it plays goes in as a 3-bet: pairs from AA down to 66 (99 to 66 partly as calls), suited aces, suited broadways, AKo to ATo, KQo, and some suited connectors like 76s, 65s and 54s. That’s much closer to a linear 3-bet-or-fold range. The big blind against the button keeps a lot of medium hands as calls instead. Position, stack depth and how often the opener folds all change the shape.
Solver baselines: fold to 3-bet
Now the other side. The CO opens to 2.5bb, the button 3-bets to 7.5bb, the blinds fold. Out of the 401 combos the CO opened with, the solver folds 63.7% (255 combos), calls 17.2% and 4-bets to 17.2bb 19.1%.
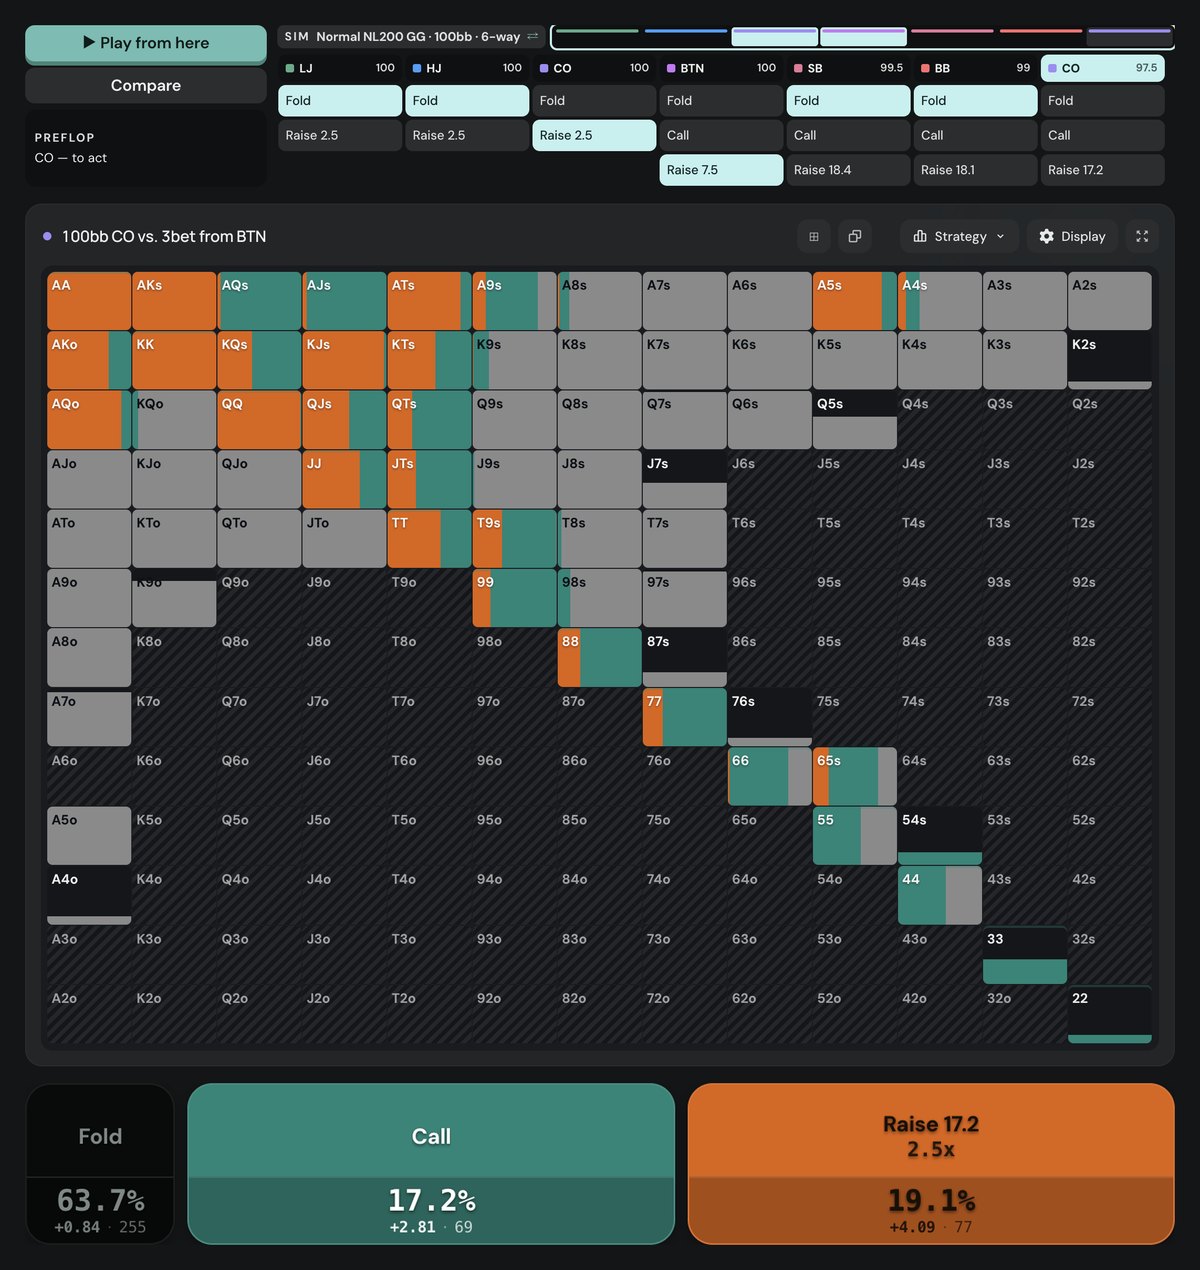
Two more spots from the same simulation, read from the app: the button facing an 11bb 3-bet from the big blind folds 68.7%, and the lojack facing a 7.5bb 3-bet from the CO folds 61.2%. So in this simulation a sound opener folds to a 3-bet somewhere around 60 to 70% of the time, depending on the seats.
That number sets the price of a bluff. A 3-bet with no equity at all breaks even when:
BTN 3-bets to 7.5bb vs a 2.5bb CO open
The solver CO folds 63.7%, a little less than 65.2%. That is why the solver’s 3-bet bluffs are hands like suited aces and suited connectors, which win some pots when called. The simplification here: I ignore that the blinds also have to fold and that a called 3-bet still has equity.
Against an opener who folds to 3-bets clearly less than that, the pure bluffs lose more, and the hands that do well against his calling range gain. My heuristic, not a solver result: 3-bet fewer bluffs and keep 3-betting value against him. The old article said to always switch to a linear range below 40% fold to 3-bet. I don’t know where that cut-off came from, and the next section shows why you’d rarely have enough hands to apply it anyway.
How many hands a stat needs
A HUD stat is an estimate of a percentage. Its uncertainty follows the standard formula for a proportion, where p is the stat and n counts opportunities, not hands played:
Standard error and 95% range of a percentage stat
Take a player whose fold to 3-bet reads 63.7%, the same as the solver CO above. This is what that reading is worth:
Fold to 3-bet 63.7% after 20 opportunities
Same stat after 100 opportunities
After 20 times facing a 3-bet, the true number could be anything from 42.6% to 84.8%. That’s a player who folds too little and a player who folds far too much, in one range. After 100 it’s 54.3% to 73.1%. And 100 times facing a 3-bet takes a lot of hands against one opponent.
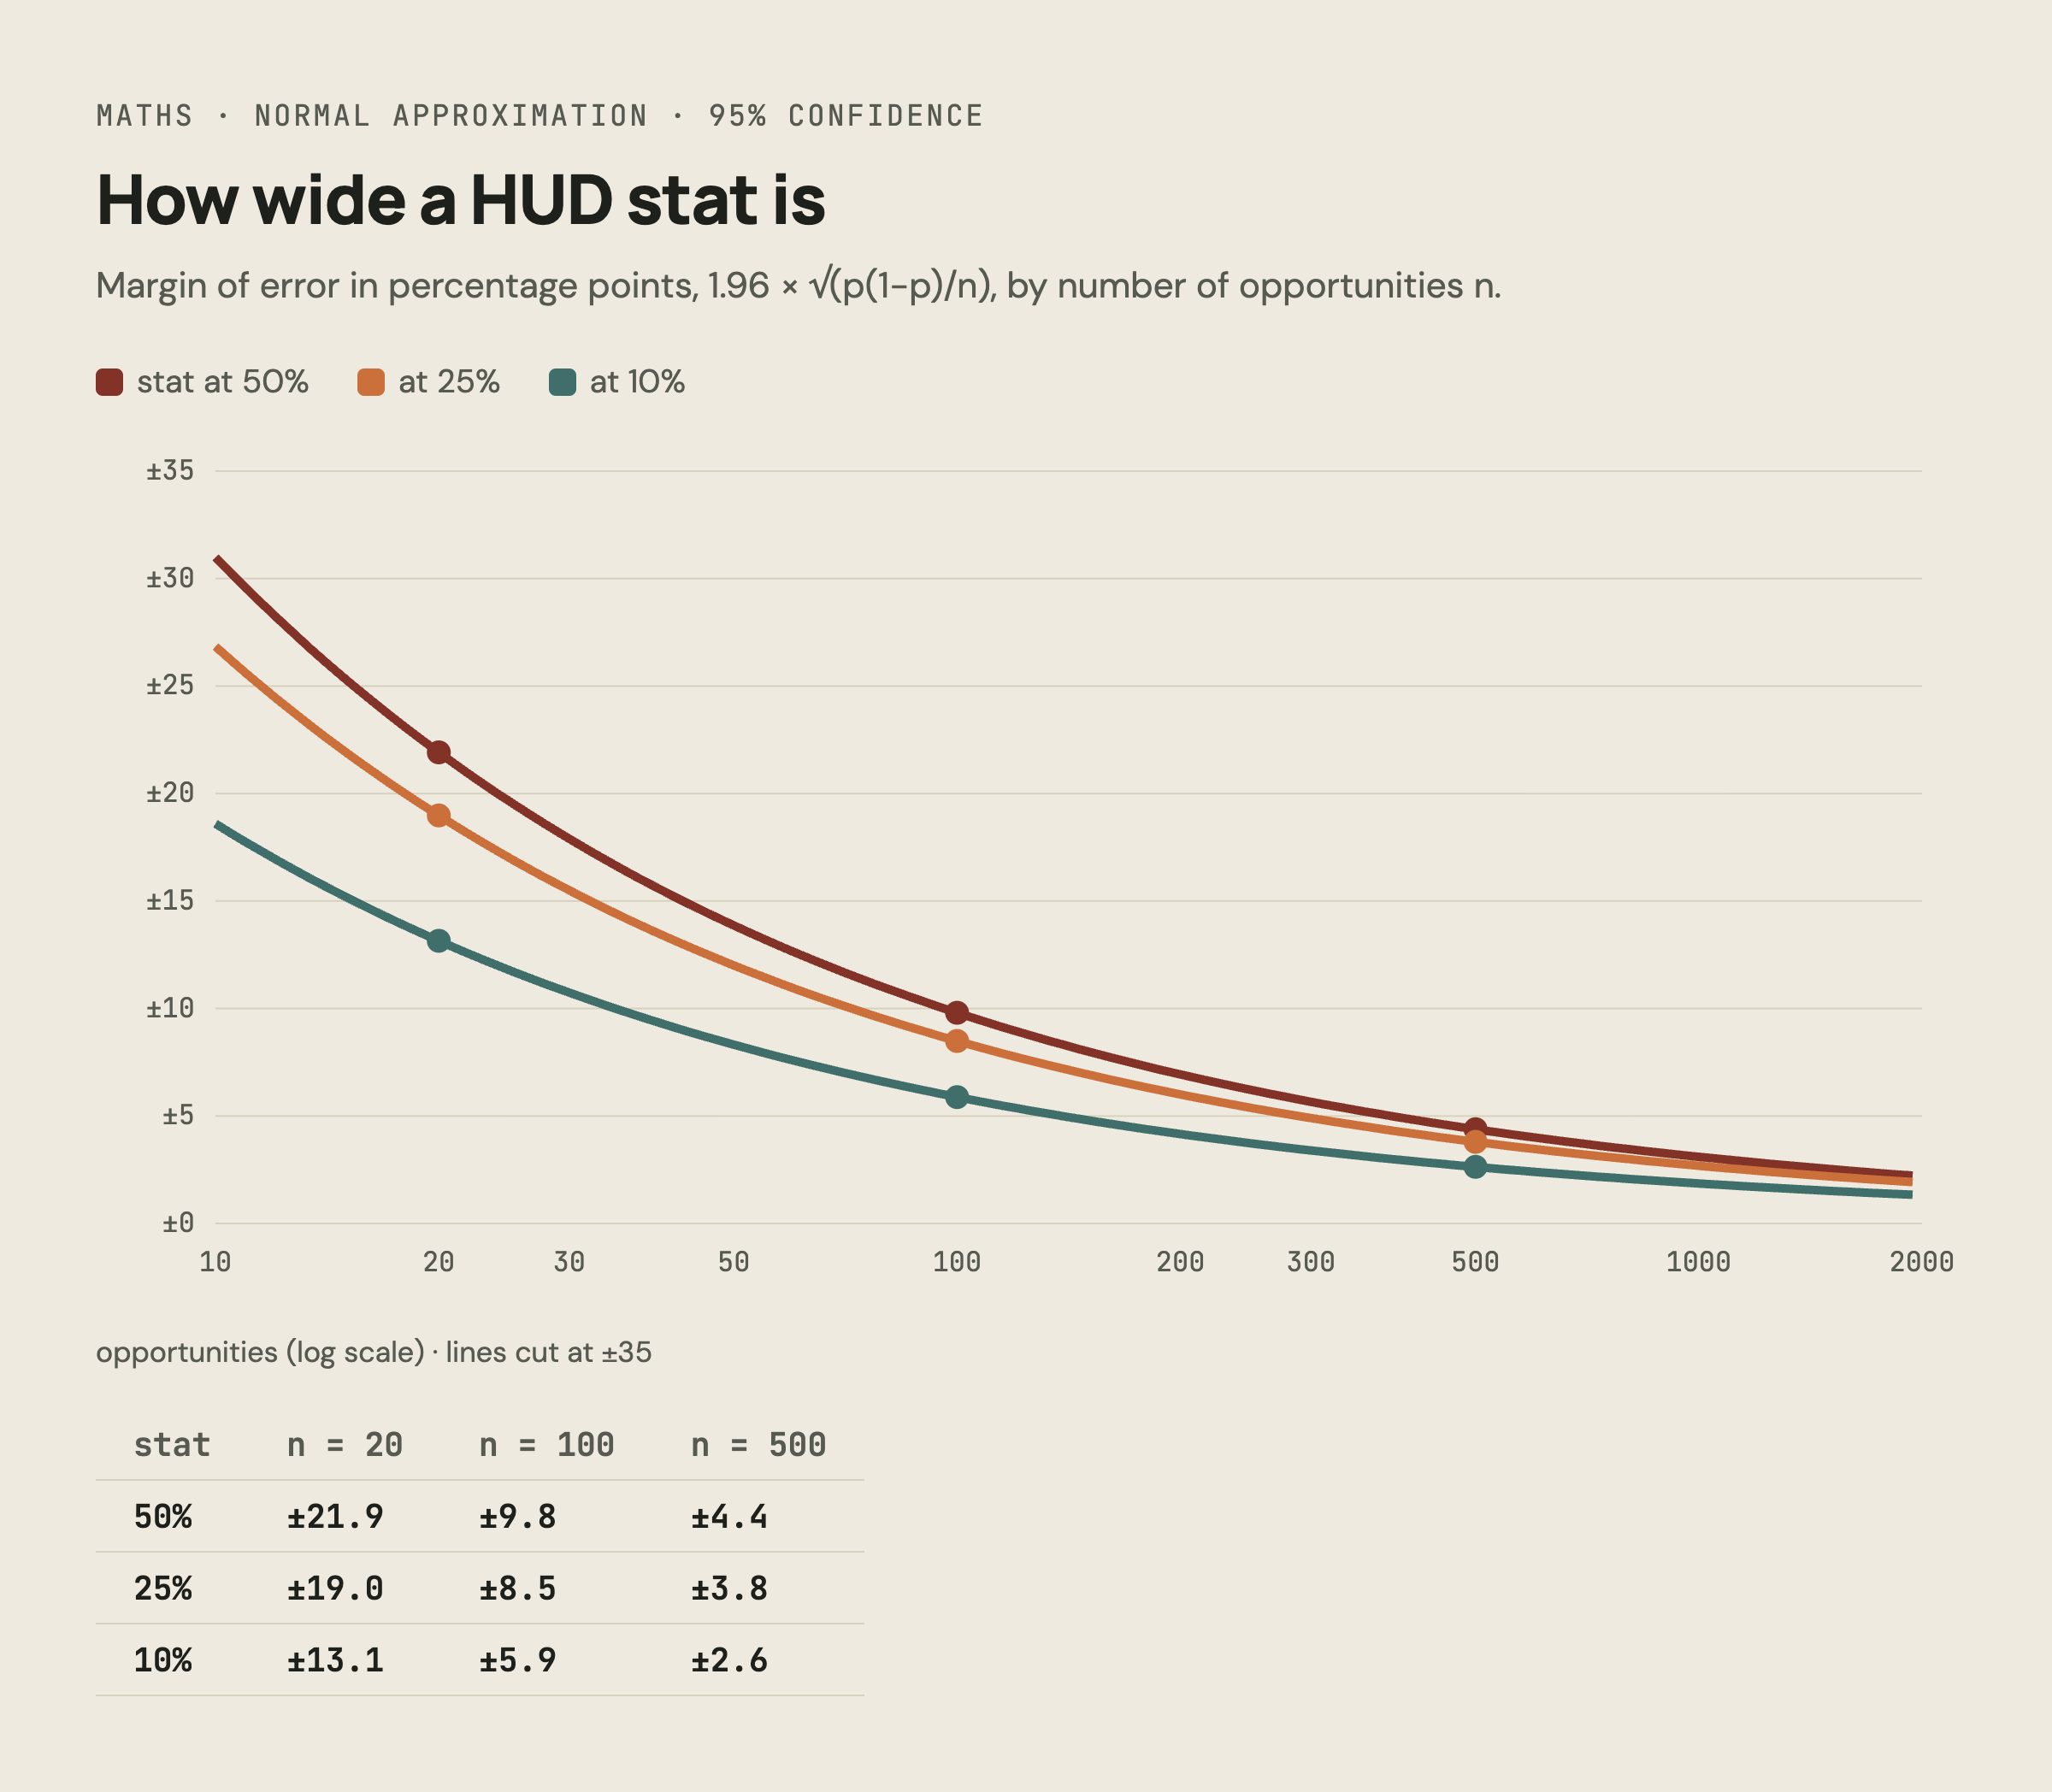
You can turn the formula around and ask how many opportunities you need before a difference from the baseline is real. Say a regular’s button open reads 35% against the solver’s 46.5%, a gap of 11.5 points:
Opportunities needed to see an 11.5-point gap (95%)
That’s 73 times folded to him on the button. At a full 6-max table he’s on the button about 1 hand in 6, and only part of those are folded to him, so this takes well over 438 hands against him (73 × 6). A 3-bet or fold-to-3-bet read takes many more.
Two caveats on the maths. The normal approximation gets rough when the count of either outcome is small; a common rule of thumb is to want at least about 10 of each. And the formula assumes his play doesn’t change, while real players tilt, move up and adjust to you.
Picking HUD software
The trackers most regulars use are PokerTracker 4, Holdem Manager 3 and Hand2Note, with DriveHUD as another option. They differ in price, in which sites and game types they support and in operating system: not all of them run on macOS. Check two things before you buy: that your site allows it, and that it imports that site’s hand histories.
Use the same tracker on yourself. Your own RFI by position and fold to 3-bet, compared with the baselines above, is a cleaner signal than any opponent’s stat, because you’ll have tens of thousands of your own hands.
Wrapping up
- A HUD stat is actions divided by opportunities. Know which one you’re looking at.
- Compare preflop stats seat by seat. In Normal NL200 GG, 6-max cash, 100bb, no ante, opens go from 18.5% in the lojack to 46.5% on the button.
- A 3-bet % only means something against a named opener: the big blind 3-bets 4.5% against a lojack and 11.5% against a button.
- After 20 opportunities a 64% stat is really 43 to 85%. Don’t build an exploit on it.
- Postflop stats have no single baseline. Solve the spot where you saw the tendency.
Cheers! 🙂
Poker Academy
Stop guessing preflop.
1,500,000+ GTO preflop solutions. Try them free for 3 days.
Start Free TrialCancel anytime.