
Equity realization (EQR) in poker: what it measures and how to read it
 DoroUpdated· first published ~10 min read
You call a button open from the big blind. The flop comes and your range has 41% equity. How much of the pot do you actually win? In the report I show below, that 41% of equity turns into 33% of the pot.
That gap has a name: equity realization, or EQR. Postflop it is one of the three numbers the app shows next to every hand, with EV and EQ. Here is what it measures, how to compute it, and what moves it: position, the board, and whether your cards are suited.
Equity is what you’d win if nobody bet again
Equity (EQ) is how often your hand wins at showdown if all the remaining cards are dealt and nobody bets or folds. Ties count as half a win. With 40.88% equity in a 5.5bb pot, your share of that pot is 0.4088 × 5.5 = 2.25bb.
Real hands don’t go that way. Players bet, raise and fold. A hand that folds to a bet gets 0% of the pot, whatever its equity was. A hand that gets paid on the river wins more than the current pot. Equity ignores both.
EV is what the hand is expected to win from here on, with every future bet and fold included. In the app it is the solver’s EV: both players play the solver strategy for the rest of the hand.
What EQR measures
EQR compares those two numbers. Take the share of the pot your hand actually wins (EV divided by the pot) and divide it by the share it would win at a check-down (EQ).
Equity realization, as the app computes it
- EQR = 1.00: the hand wins exactly its equity share of the pot.
- EQR above 1: the hand over-realizes. It wins more than its equity, because it gets paid or makes better hands fold.
- EQR below 1: the hand under-realizes. It folds too often, gets bet off its equity, or pays off when behind.
Two things it is not. EQR is not the percentage of the pot you win, which is EV divided by the pot. And it is not a probability, so it can be above 100%: a hand with 93% equity that wins 253% of the pot has an EQR of 272%.
A real spot: 20bb, button against the big blind
Here is a flop report in Poker Academy. The spot: MTT, 20bb, 9-handed, 1bb big-blind ante. The button opens to 2bb, the big blind calls. Pot on the flop: 2 + 2 + 0.5 + 1 = 5.5bb, effective stack 18bb. The report solved 25 flops with one flop bet menu (19%, 30%, 60% and 120% of pot) and weights each flop by how often it comes up.
The bet menu matters here. EQR is a ratio of EV to equity, and EV depends on which bet sizes the solver was allowed to use, so averaging flops solved with different menus mixes two things at once. Every aggregate in this article comes from a report with a single menu.
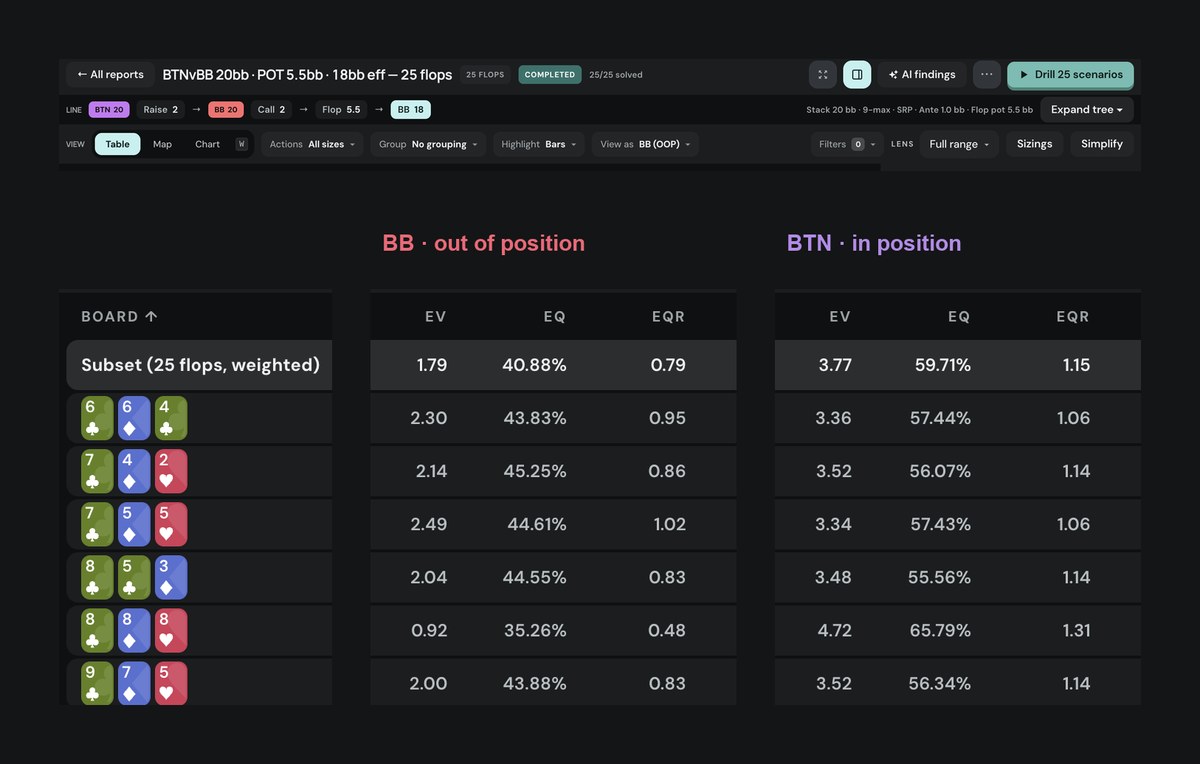
Across all 25 flops the big blind has 40.88% equity and 1.79bb of EV. The button has 59.71% equity and 3.77bb. Put the big blind’s numbers in the formula:
Big blind, all 25 flops
Button, all 25 flops
So the big blind wins 32.6% of the pot with 40.9% equity. The button wins 68.5% of it with 59.7% equity. At a check-down the big blind would get 2.25bb. With betting it gets 1.79bb, and the button takes the difference.
One detail if you check the table yourself: the report’s EQR column averages the EQR of each flop, while my formula divides the averaged EV by the averaged equity. The two differ by a hundredth here (0.79 against 0.80) and on the cash report further down (0.86 against 0.87). Both are fair summaries of the same solves, they just weight things differently.
Position: the player who acts last realizes more
This is the biggest single factor, and it showed up in every report I checked. The player in position sees the other player act first on every street. He can check behind with a medium hand and take a free card, bet when checked to, and fold cheaply when the other player shows strength. Out of position you commit first, with less information.
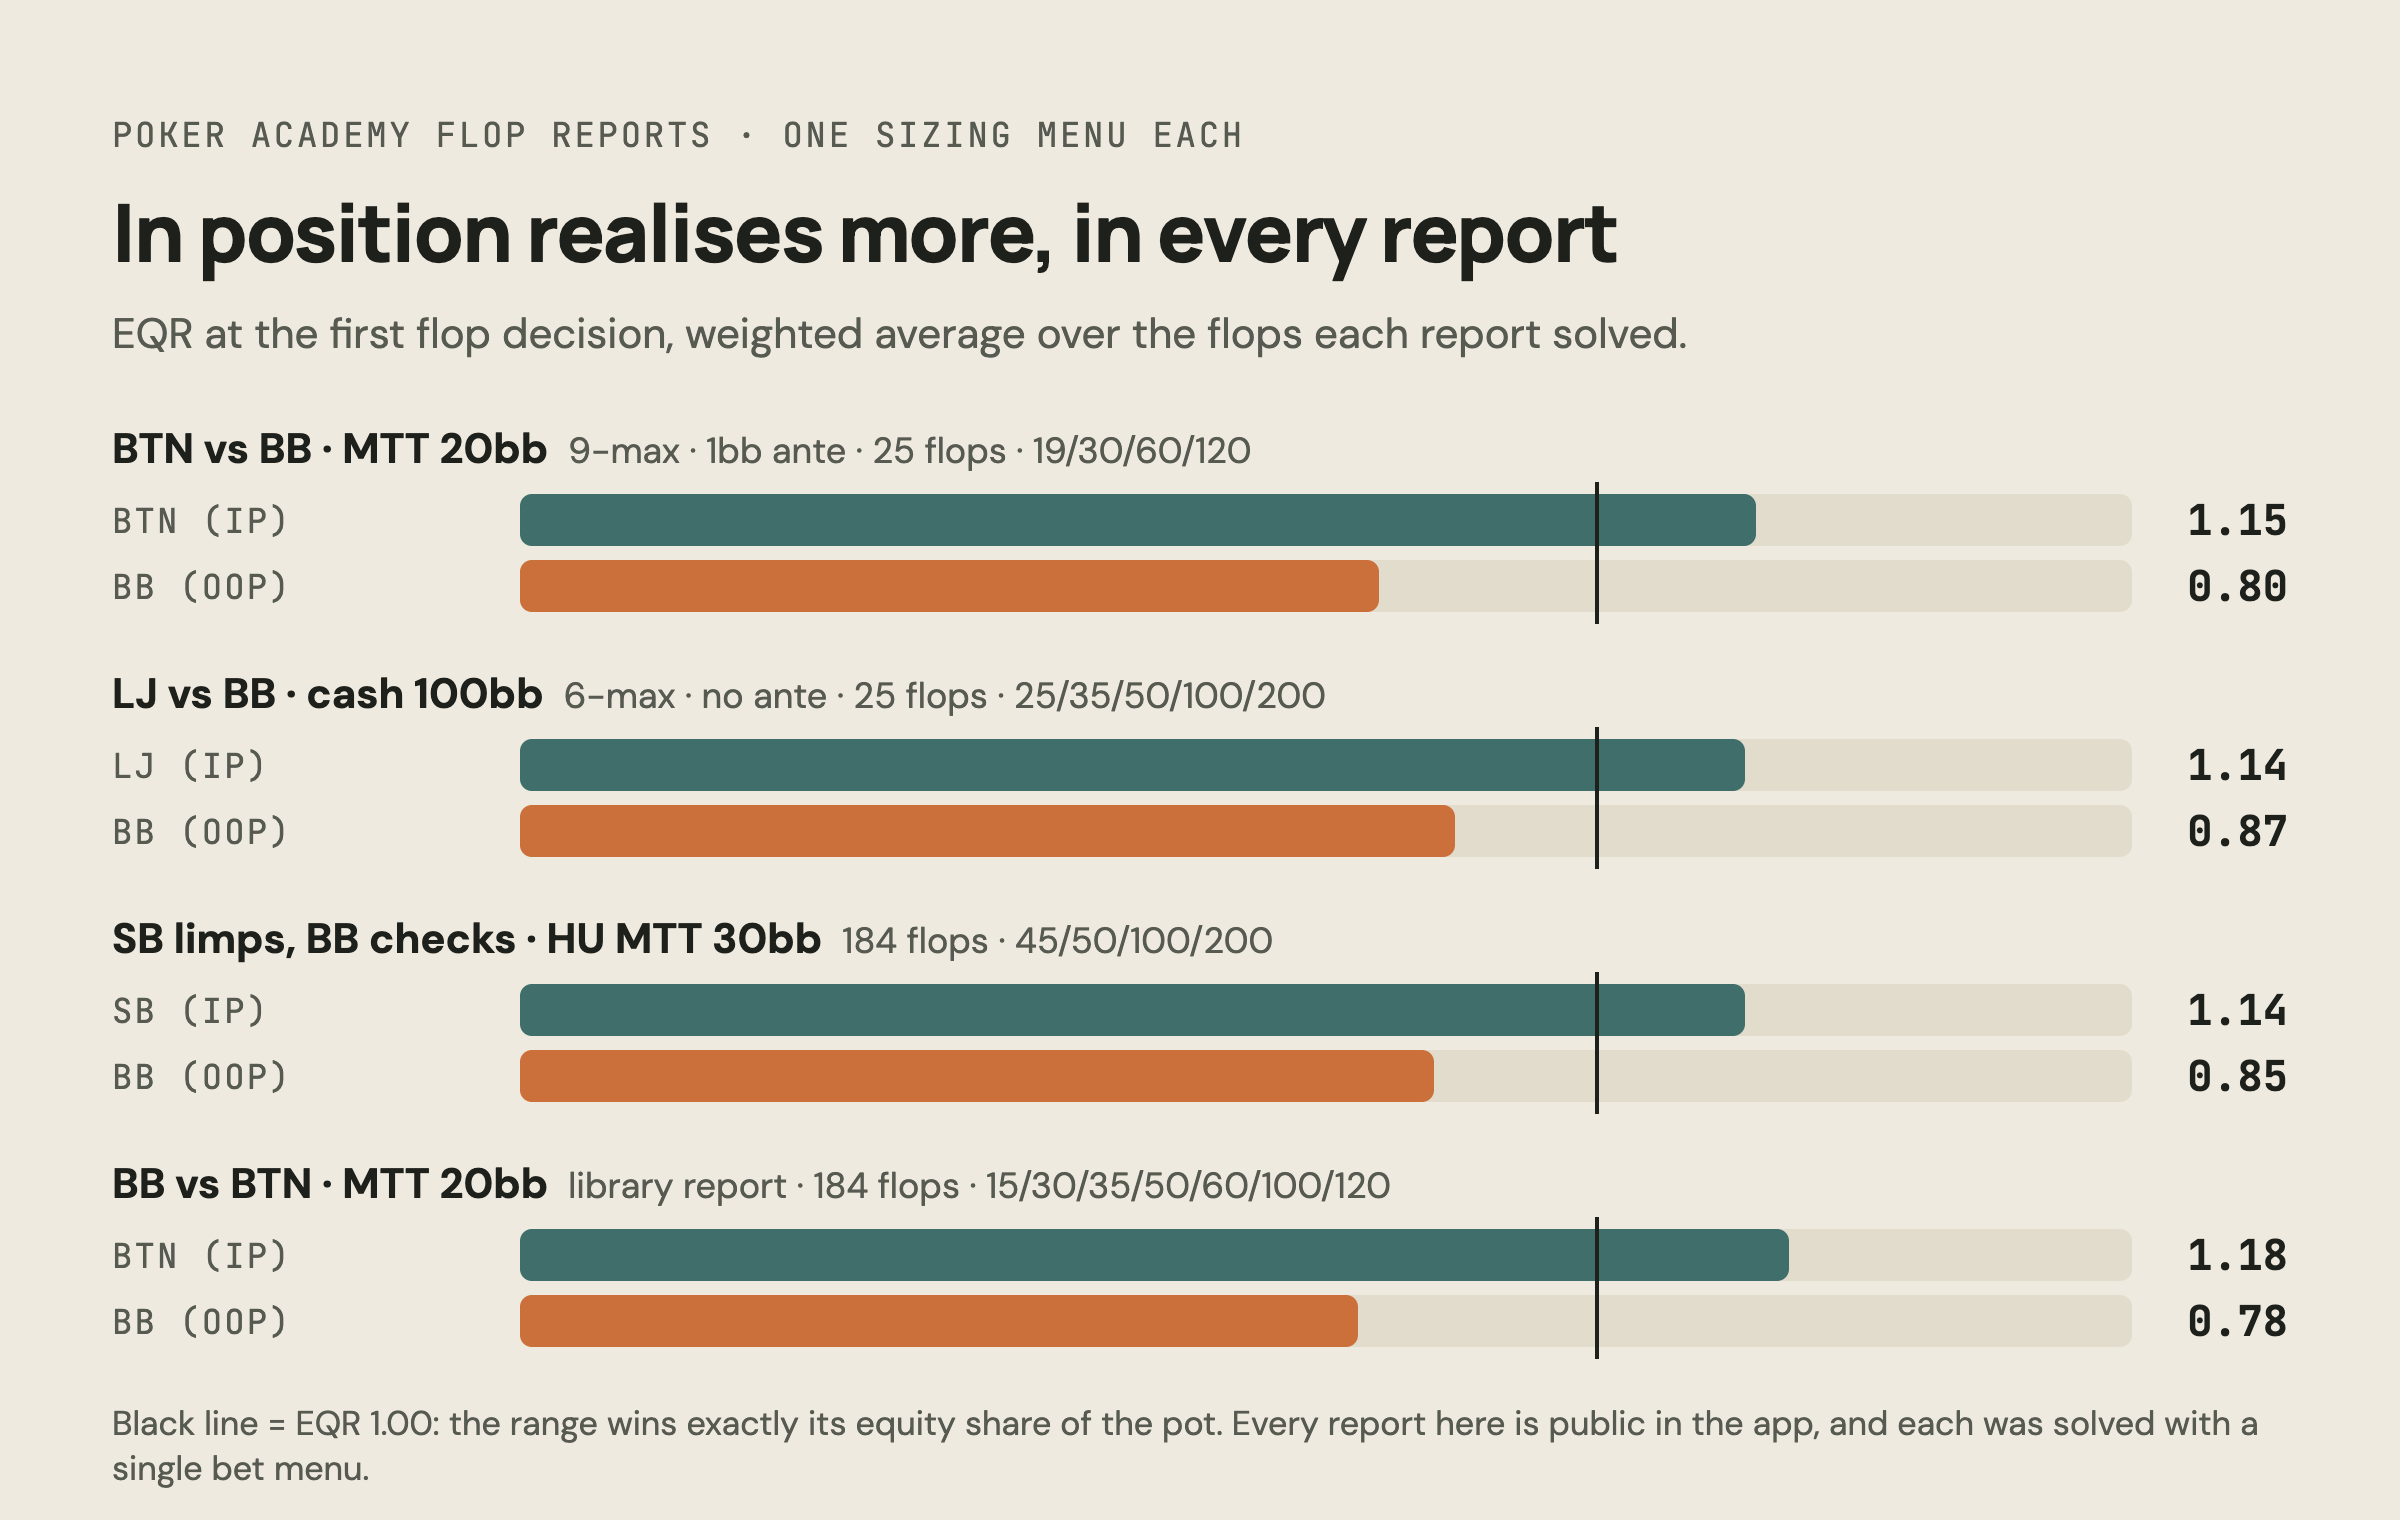
- BTN vs BB, MTT 20bb, 25 flops: 1.15 in position, 0.80 out of position.
- LJ opens, BB calls, 6-max cash 100bb, no ante, 25 flops: 1.14 against 0.87.
- SB limps, BB checks, heads-up MTT 30bb, 184 flops: 1.14 against 0.85.
- BTN opens, BB calls, MTT 20bb, 184 flops: 1.17 against 0.78.
Those are four different formats, stack depths and pot sizes, and the player in position lands between 1.14 and 1.17 in all of them. It never comes near 1.00. The out-of-position number moves much more, 0.78 to 0.87, because it depends on how badly that range is outgunned.
These are averages over the flops each report solved, so they say how the whole range does, not how every hand does.
The board decides how much position costs
Take the 184-flop heads-up report (MTT 30bb, the small blind limps and the big blind checks) and split it by the highest card on the flop.
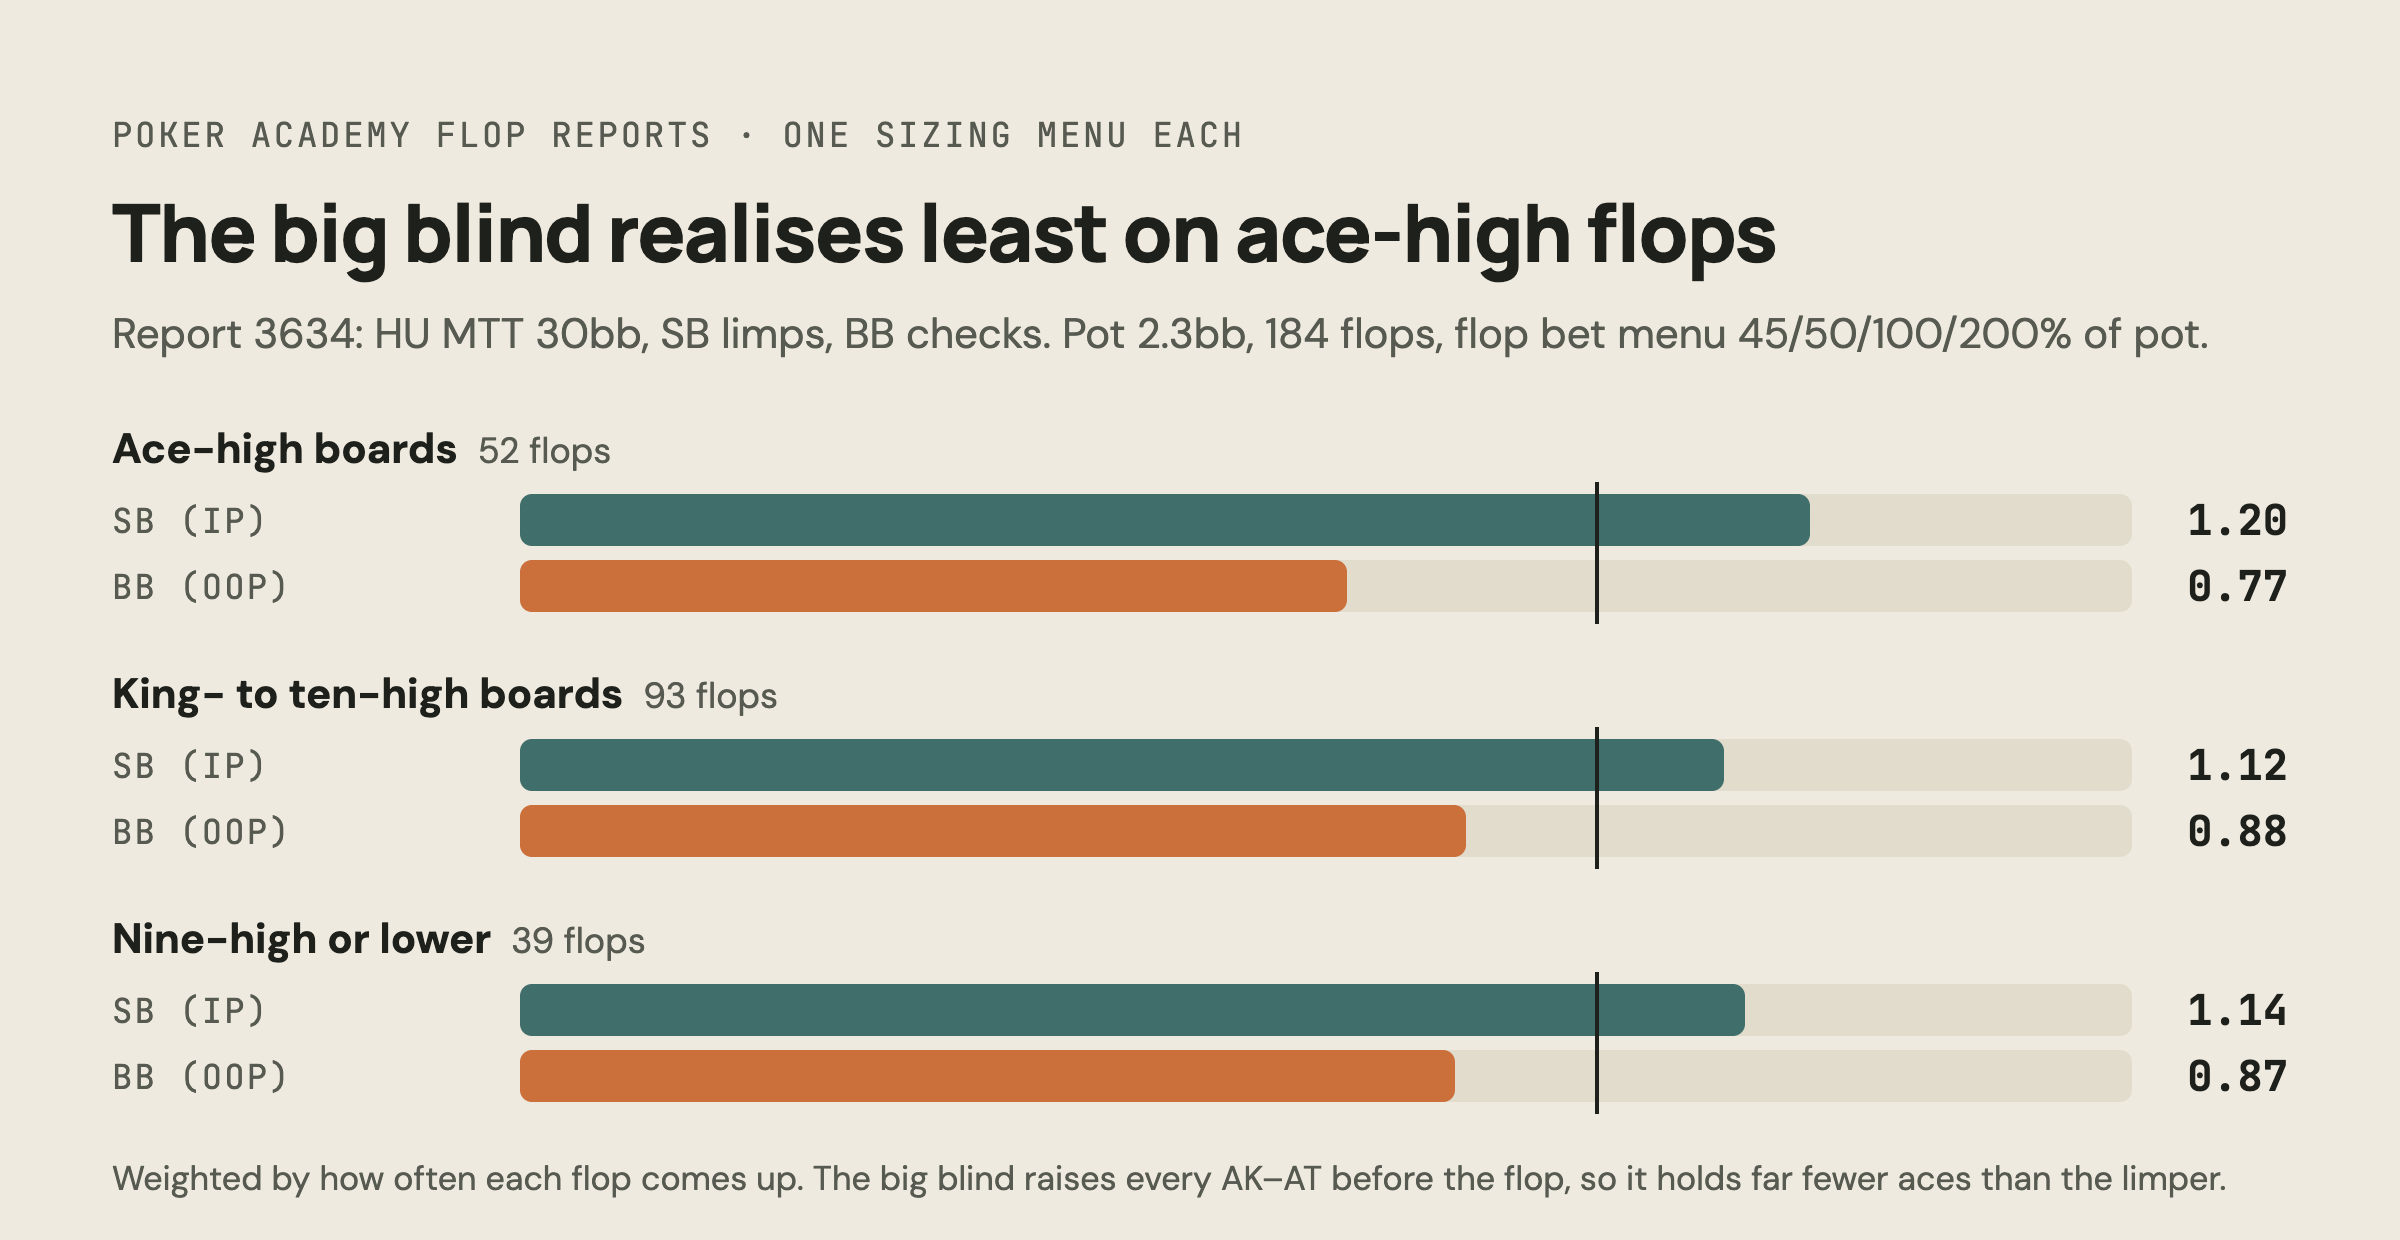
On ace-high flops the big blind realizes 0.77 of its equity. On everything else it sits at 0.87 to 0.88, and its raw equity barely moves (46.9% against 48.5% and 48.8%). The reason sits preflop, in the same simulation. Facing a limp at 30bb the big blind raises or jams every AKs–ATs and every AKo–A9o, so its checking range (845.5 combos) holds zero AK–AT and only 5.5% ace-containing combos. The limper’s range (781.7 combos) keeps 12.7%. An ace on the flop hits one player and misses the other.
Single flops spread wider than the groups. In the 25-flop report at the top of this article, the big blind realizes 0.62 on A♣︎5♦︎3♥︎ (39.82% equity, 1.35bb of EV), 0.83 on 9♣︎7♦︎5♥︎ (43.88%, 2.00bb) and 0.86 on 7♣︎4♦︎2♥︎ (45.25%, 2.14bb). On 8♣︎8♦︎8♥︎ it gets 0.48 (35.26%, 0.92bb), because almost nothing in its range can be ahead there.
Inside the range: suited hands and draws
Averages hide a wide spread between hands. Browse has an EQR view of the matrix, where every tile shows that class’s EQR at the current node. Here is the big blind’s first decision on 9♣︎7♦︎5♥︎, one of the 25 solved boards of the report above, opened straight from the solution.
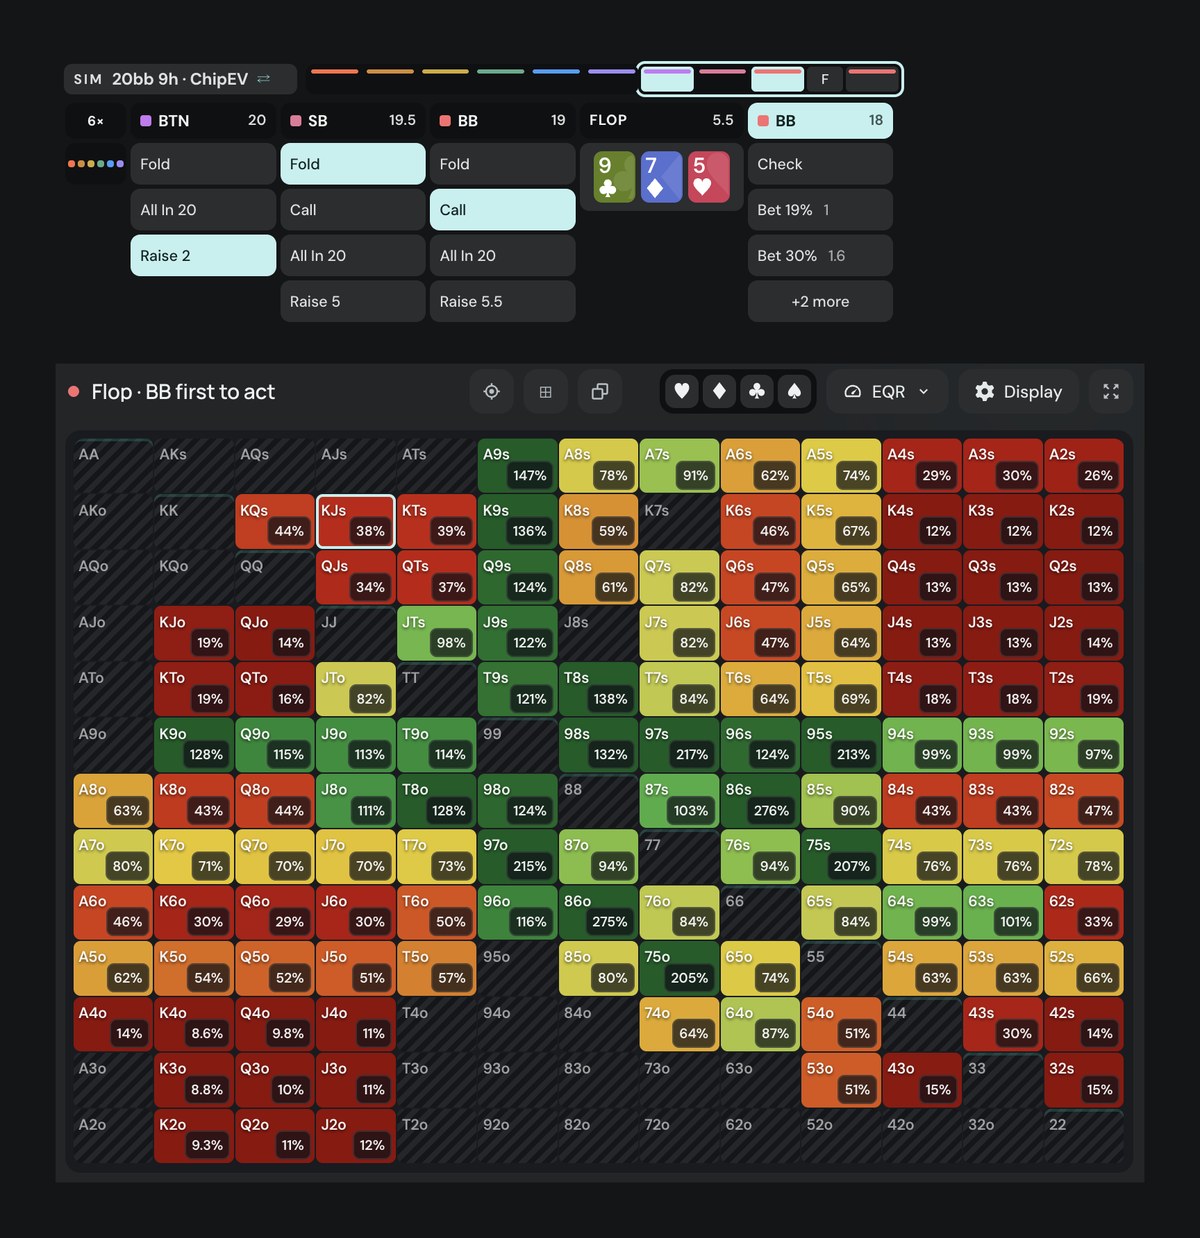
Made straights (86s at 276%, 86o at 275%) and two pair (97s at 217%, 75s at 207%) sit far above 100%, because they get paid. Offsuit broadway hands with no pair and no open-ended draw sit at the other end: QJo 14%, QTo 16%, KJo 19%, KTo 19%. KJo still has 36% equity, and it gives almost all of it up once the button bets.
Now compare the suited and offsuit versions of the same hand. KJs shows 38%, KJo 19%. QTs 37%, QTo 16%. QJs 34%, QJo 14%. The combos list says why.
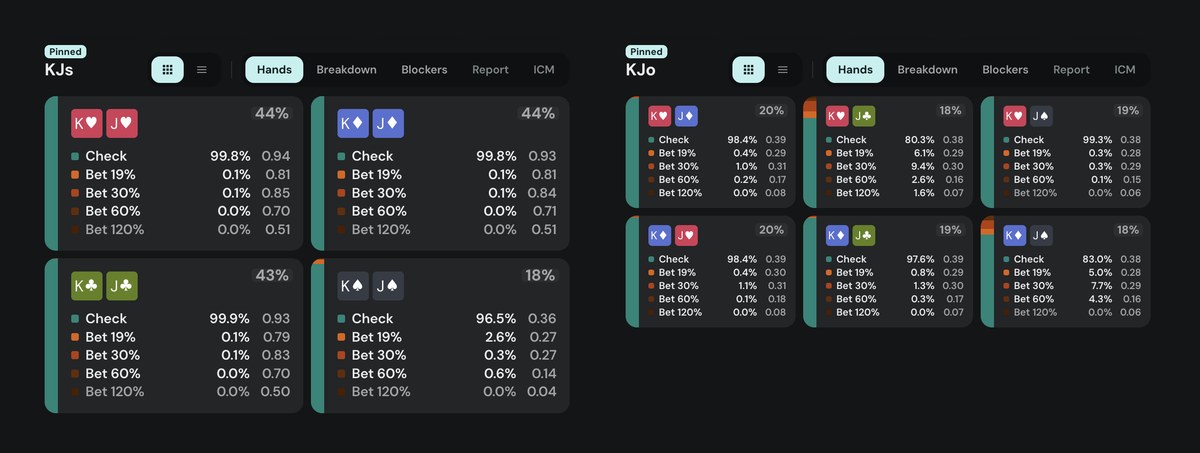
K♥︎J♥︎, K♦︎J♦︎ and K♣︎J♣︎ each have about 0.94bb of EV, 39% equity and an EQR of 43 to 44%. K♠︎J♠︎ has 0.36bb, 36% and 18%, in line with every offsuit combo (0.37 to 0.39bb, 18 to 20%). Count the cards. The flop is 9♣︎ 7♦︎ 5♥︎: one club, one diamond, one heart, no spade. K♥︎J♥︎ plus 5♥︎ is three hearts, a backdoor flush draw, and the same holds for diamonds and clubs. K♠︎J♠︎ can’t make a flush at all, because two spades in hand plus a turn and a river is four spades at most.
Same hand, one backdoor flush draw apart
The app shows 18% for K♠︎J♠︎ because it divides unrounded EV and equity; with the rounded 0.36bb and 36% you get 0.18.
Under three points of equity make a 0.58bb difference in EV. My reading of why (the solver gives the numbers, not the reason): the backdoor draw gives the hand more ways to continue, because a fourth heart on the turn turns it into a real flush draw. That is what “playability” looks like in numbers. Being suited does nothing on its own here; being suited with a live draw does.
And at the top end, 8♥︎6♥︎ makes a straight (9, 8, 7, 6, 5) with 14.19bb of EV and 93% equity:
Made straight on 9♥7♠5♣
The app shows 276% for that combo; my 2.77 uses the equity rounded to 93%.
Stack depth
A heuristic, not something these reports prove: deeper stacks give the player in position more streets and bigger bets to use, so position is worth more when the stack-to-pot ratio (SPR) is high. At a low SPR more hands end all-in, and a hand that is all-in reaches showdown and realizes its equity exactly, EQR 1. So short stacks push EQR towards 1 for both players, and deep stacks spread it apart.
These four reports don’t isolate it. The 20bb spot has an SPR of about 3.3 (18 / 5.5), the 184-flop 20bb report 2.3 (17 / 7.5), the limped heads-up pot 12.6 (29 / 2.3) and the cash spot 17.7 (97.5 / 5.5). They also differ in positions, ranges, ante and bet menu. To test it properly you would compare the same positions at two stack depths.
Where EQR is not shown, and why
On preflop nodes Browse shows EV for every hand, and the EQR column stays a dash. Preflop EV is measured against folding, and a preflop matrix has no pot for EV and equity to share. Dividing them would give a number that looks like EQR and means nothing, so the app leaves it blank.
EQR also assumes both players play the solver strategy. As a rule of thumb, not solver output: against a player who folds too much your real EQR is higher than the solver’s, and against one who never folds, hands that rely on bluffing realize less. You make that adjustment yourself. The number in the app is the equilibrium one.
One more thing worth knowing if you read these reports yourself. The two players’ equity columns should add up to 100% on every flop, and in the reports used here they do, within about a point (99.8% to 102.2% per flop in the 20bb report). Some reports don’t. I dropped a second library report from this article because its two equity columns add up to 104.4% on the median flop and up to 107.6% on the worst one. If the equities don’t add up, the EQR built on them isn’t worth quoting.
How to use it
- Don’t call on equity alone. Out of position with a hand that under-realizes, the equity you need to call is not the EV you’ll get.
- Prefer hands that keep playing. Among hands with similar equity, the ones with draws and live cards realize more, and in the big blind that is often the suited version.
- Expect position to cost you. In all four reports above the out-of-position range realized 0.78 to 0.88 of its equity, and the in-position range 1.12 to 1.17.
- Check the board. The same range realized 0.48 on 8♣8♦8♥ and 0.86 on 7♣4♦2♥ in one report.
Open a spot you play in Browse, switch the matrix to EQR and click through a few hands. The pattern shows up fast.
Cheers! 🙂
Keep reading
All posts
Poker Academy
Stop guessing preflop.
1,500,000+ GTO preflop solutions. Try them free for 3 days.
Start Free TrialCancel anytime.